
Cincinnati, OH-KY-IN · metro guide
Solar Panels in Cincinnati: Older Roofs, Four Seasons
Cincinnati has workable sun and a lot of old roofs. The sequencing question comes before the equipment question.
Metro snapshot
Cincinnati in numbers
Sources named below each block
- Population
- 2.3M
- Households
- 907K
- Housing units
- 967K
- People / household
- 2.50
- population ÷ households
Owner-occupied homes 68%
The rest are rented. Owners are the ones who commission most exterior work.
Single-family detached 66%
Detached houses carry their own roof, gutters and exterior walls.
Built before 1980 56%
Older housing stock shapes what fails first: gutters, flashing, pipe material.
Season
The year in Cincinnati
- Precipitation
- 45.3 in
- Snowfall
- 23.3 in
Average temperature by month, °F — the shape of the year is what decides when exterior work gets done.
Precipitation by month, inches.
Snowfall by month, inches.
| Month | Average temperature (°F) | Precipitation (in) | Snowfall (in) |
|---|---|---|---|
| January | 31.4°F | 3.30 in | 7.7 in |
| February | 34.7°F | 3.17 in | 6.7 in |
| March | 43.6°F | 4.16 in | 3.4 in |
| April | 54.6°F | 4.53 in | 0.4 in |
| May | 64.1°F | 4.67 in | 0.0 in |
| June | 72.3°F | 4.75 in | 0.0 in |
| July | 75.9°F | 3.83 in | 0.0 in |
| August | 74.9°F | 3.43 in | 0.0 in |
| September | 68.1°F | 3.11 in | 0.0 in |
| October | 56.2°F | 3.35 in | 0.2 in |
| November | 44.4°F | 3.23 in | 0.8 in |
| December | 35.6°F | 3.73 in | 4.1 in |
NOAA 1991–2020 climate normals, station CINCINNATI NORTHERN KY AP, KY US (USW00093814). Station observations, not a metro-wide average — a metro that spans a mountain range can differ by more than this record shows.
Population, households and housing shares: U.S. Census Bureau, American Community Survey 2024 5-year estimates, metropolitan statistical area.
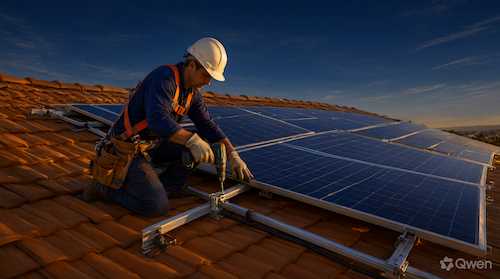
About 55.7% of Cincinnati metro housing units were built before 1980, according to ACS estimates, so the roof receiving a solar array is often older than the system would be. The region's four-season climate also means production is strongly seasonal and never negligible in winter, but far below summer. Both facts belong in the proposal, not in a footnote.
Roof condition before production
Ask how the installer evaluates roof condition and when it was last replaced. Removing and reinstalling an array for a roof replacement is a real cost, and it is usually excluded from both the solar contract and the roof warranty. If the roof has a few years left, sequencing the work is cheaper than discovering the problem later.
Mature trees and winter sun
Ask how shade was measured and whether the analysis covers the full year. Older neighborhoods have canopies that shade roofs in summer and, with a low winter sun, in December as well. Ask which roof planes are proposed and why, and whether module-level electronics are used to reduce partial-shade losses.
Seasonal production
Ask for estimated production by month rather than an annual total. Winter output is much lower, and snow can interrupt it for days. Compare the monthly curve with the household's own consumption pattern, because a summer-heavy profile is worth less if most demand is in winter.
Mounting, electrical, and interconnection
Ask how penetrations are flashed and sealed, where the inverter will be mounted, and whether a main panel upgrade is included. Ask who handles the utility interconnection application and what the inspection sequence looks like. Those details decide whether the project finishes on schedule.
Questions to ask before signing
Where this page stops
This page does not estimate production, savings, or payback for a specific property and does not confirm which incentives or utility rules apply. Those depend on the roof, shading, equipment, and current tariff and tax rules, which should be checked with the relevant official source.
Cincinnati metro context
The 2024 ACS 5-year estimates put the metro at about 2.3 million residents and 907,000 households. About 68.3% of occupied homes are owner-occupied, and about 66.3% of housing units are single-family detached, the segment where rooftop solar is most common. About 55.7% of housing units were built before 1980. This page reports Census indicators only; a NOAA station is not included for this metro in the site dataset.
Cincinnati metro housing indicators
| Indicator | Value | Source |
|---|---|---|
| Metro population | 2,270,706 | U.S. Census Bureau |
| Households | 906,675 | U.S. Census Bureau |
| Owner-occupied share | 68.3% | U.S. Census Bureau |
| Single-family detached share | 66.3% | U.S. Census Bureau |
| Housing units built before 1980 | 55.7% | U.S. Census Bureau |
Census values describe the metro area, not an individual property. A climate station is not reported for this metro in the site dataset.
Frequently Asked Questions
What should I compare between solar quotes in Cincinnati?
Compare the gross cash price, system size, equipment models, monthly production estimates, roof condition and attachment details, included electrical work, exclusions, and each warranty.
Should I replace my roof before installing solar?
If the roof is near the end of its service life, it is usually cheaper to address it first. Ask how condition is evaluated and who pays for removal and reinstallation later.
How much does winter reduce production?
Production is much lower in winter than summer, and snow can interrupt it for short periods. Ask for monthly estimates so the seasonal shape is visible.
Do trees really affect solar here?
In older neighborhoods they often do, in summer and again in winter when the sun is low. Ask for a shade analysis covering the full year.
Who handles permits and utility interconnection?
It varies by contract. Ask which party prepares the permit and interconnection application, who schedules inspections, and who confirms permission to operate.
What is the population of the Cincinnati metro area?
The U.S. Census Bureau's 2024 ACS 5-year estimates report about 2.3 million residents in the metro area. The figure describes regional scale, not the number of homes or providers.
Sources and review date
- American Community Survey 2024 5-year estimates (CBSA tables) — U.S. Census Bureau, 2024 ACS 5-year estimates.
Reviewed on 2026-11-18.