
Denver, CO · metro guide
Landscaping in Denver: Dry Air, Clay Soil, and Hail
Denver gardens are limited by water and soil, not by rain. A plan that ignores either is a plan for replacement planting.
Metro snapshot
Denver in numbers
Sources named below each block
- Population
- 3.0M
- Households
- 1.2M
- Housing units
- 1.3M
- People / household
- 2.46
- population ÷ households
Owner-occupied homes 64%
The rest are rented. Owners are the ones who commission most exterior work.
Single-family detached 57%
Detached houses carry their own roof, gutters and exterior walls.
Built before 1980 41%
Older housing stock shapes what fails first: gutters, flashing, pipe material.
Season
The year in Denver
- Precipitation
- 14.5 in
- Snowfall
- —
Average temperature by month, °F — the shape of the year is what decides when exterior work gets done.
Precipitation by month, inches.
| Month | Average temperature (°F) | Precipitation (in) | Snowfall (in) |
|---|---|---|---|
| January | 31.7°F | 0.38 in | — |
| February | 32.7°F | 0.41 in | — |
| March | 41.6°F | 0.86 in | — |
| April | 47.8°F | 1.68 in | — |
| May | 57.4°F | 2.16 in | — |
| June | 68.2°F | 1.94 in | — |
| July | 75.1°F | 2.14 in | — |
| August | 72.9°F | 1.58 in | — |
| September | 64.8°F | 1.35 in | — |
| October | 51.1°F | 0.99 in | — |
| November | 39.4°F | 0.64 in | — |
| December | 31.2°F | 0.35 in | — |
NOAA 1991–2020 climate normals, station DENVER INTL AP, CO US (USW00003017). Station observations, not a metro-wide average — a metro that spans a mountain range can differ by more than this record shows.
Population, households and housing shares: U.S. Census Bureau, American Community Survey 2024 5-year estimates, metropolitan statistical area.
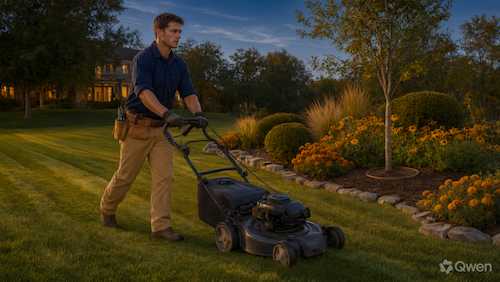
Denver gets about 14.5 inches of precipitation a year, with most of it arriving in spring and summer storms rather than steadily. The air is dry, the sun is intense at this elevation, and much of the soil along the Front Range is clay that holds water and then dries hard. A landscape here is really a water and soil design, and it has to survive hail as well.
Clay soil and drainage
Ask how the soil was assessed and what amendment is included. Clay absorbs water slowly, so irrigation applied too fast runs off, and planting holes can hold water like a bucket. Ask whether the plan accounts for that with amendment, mounding, or a different planting approach.
Water-wise planting
Ask which plants are proposed and what they need once established, and whether the plan treats lawn areas separately from beds. Reducing lawn is the simplest way to cut water use, but it changes how the yard is used. Ask how the design handles the transition and whether the irrigation is zoned to match.
Irrigation efficiency
Ask how zones are divided, what emitter layout is proposed, and whether the controller can be adjusted seasonally. Ask how the plan avoids overspray onto walls, paving, and fences. In a dry climate a system that runs on a fixed schedule is usually wasting water somewhere.
Hail and short seasons
Ask how the planting plan handles hail damage and how quickly plants recover or need replacing. Ask whether tender annuals are part of the design and what the establishment period looks like around the first frost. A plan that assumes a long growing season will disappoint.
Questions to ask before approving a plan
Where this page stops
This page does not design a landscape or estimate cost for a specific property. Plant suitability, water-use rules, and any municipal or association requirements vary by address and should be confirmed locally.
Denver metro context
The 2024 ACS 5-year estimates put the metro at about 3.0 million residents and 1.2 million households. About 64.1% of occupied homes are owner-occupied, and about 57.1% of housing units are single-family detached, so most landscaping work happens on private lots. About 41.0% of housing units were built before 1980. NOAA's Denver station records January averaging 31.7°F, July 75.1°F, and about 14.5 inches of precipitation a year.
Denver reference station and housing indicators
| Indicator | Value | Source |
|---|---|---|
| January mean temperature | 31.7°F | NOAA NCEI |
| July mean temperature | 75.1°F | NOAA NCEI |
| Annual precipitation | 14.5 in. | NOAA NCEI |
| Metro population | 3,002,721 | U.S. Census Bureau |
| Owner-occupied share | 64.1% | U.S. Census Bureau |
| Single-family detached share | 57.1% | U.S. Census Bureau |
Station normals are historical averages for one location, not a forecast. Census values describe the metro area, not an individual property.
Frequently Asked Questions
What should a Denver landscaping estimate include?
Ask for the plan drawing, plant list with sizes and water needs, soil amendment, mulch, irrigation layout and controller, any hardscape or grading, disposal, a schedule, exclusions, and the establishment terms.
Why does water run off instead of soaking in?
Clay soil absorbs slowly, so water applied faster than it can infiltrate runs off. Amendment, mounding, and shorter irrigation cycles can help; ask what the plan specifies.
How much does lawn cost to keep in Denver?
Lawn is usually the thirstiest part of a landscape here. Ask what the plan expects in gallons per week and what a reduced-lawn alternative would look like.
When is the planting season?
It depends on the species and the year's weather, and establishment needs to be complete before the first hard freeze. Ask what the schedule assumes and how the contractor handles an early frost.
Does hail kill new plantings?
It can damage them, and some plants recover better than others. Ask how the design accounts for hail and what the establishment warranty covers.
What is the population of the Denver metro area?
The U.S. Census Bureau's 2024 ACS 5-year estimates report about 3.0 million residents in the metro area. The figure describes regional scale, not the number of homes or providers.
Sources and review date
- American Community Survey 2024 5-year estimates (CBSA tables) — U.S. Census Bureau, 2024 ACS 5-year estimates.
- 1991–2020 station normals — DENVER INTL AP, CO US (USW00003017) — NOAA National Centers for Environmental Information, 1991–2020 climate normals.
Reviewed on 2026-11-17.