
Nashville, TN · metro guide
Window Cleaning in Nashville: Limestone Dust, Cedar Pollen and Fast Growth
A metro that has been building for a decade, on limestone ground, with a pollen season that arrives in winter.
Metro snapshot
Nashville in numbers
Sources named below each block
- Population
- 2.1M
- Households
- 829K
- Housing units
- 897K
- People / household
- 2.51
- population ÷ households
Owner-occupied homes 65%
The rest are rented. Owners are the ones who commission most exterior work.
Single-family detached 64%
Detached houses carry their own roof, gutters and exterior walls.
Built before 1980 32%
Older housing stock shapes what fails first: gutters, flashing, pipe material.
Season
The year in Nashville
- Precipitation
- 50.5 in
- Snowfall
- 4.7 in
Average temperature by month, °F — the shape of the year is what decides when exterior work gets done.
Precipitation by month, inches.
Snowfall by month, inches.
| Month | Average temperature (°F) | Precipitation (in) | Snowfall (in) |
|---|---|---|---|
| January | 39.6°F | 4.02 in | 2.0 in |
| February | 43.4°F | 4.47 in | 1.5 in |
| March | 51.5°F | 4.52 in | 0.7 in |
| April | 60.8°F | 4.72 in | 0.0 in |
| May | 69.3°F | 5.02 in | 0.0 in |
| June | 77.1°F | 4.36 in | 0.0 in |
| July | 80.7°F | 4.16 in | 0.0 in |
| August | 79.7°F | 3.79 in | 0.0 in |
| September | 73.1°F | 3.80 in | 0.0 in |
| October | 61.7°F | 3.36 in | 0.0 in |
| November | 50.3°F | 3.86 in | 0.1 in |
| December | 42.7°F | 4.43 in | 0.4 in |
NOAA 1991–2020 climate normals, station NASHVILLE INTL AP, TN US (USW00013897). Station observations, not a metro-wide average — a metro that spans a mountain range can differ by more than this record shows.
Population, households and housing shares: U.S. Census Bureau, American Community Survey 2024 5-year estimates, metropolitan statistical area.
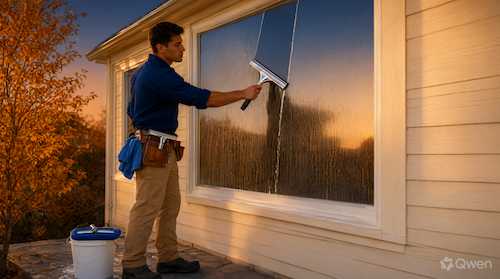
Nashville gets 50.5 inches of rain and a July mean of 80.7°F, and only 31.7% of its housing predates 1980 — the newest stock of the older metros in this set, and a direct reflection of how fast the region has grown. That growth is the glass problem: graded limestone ground produces pale dust continuously, and it settles on windows in neighborhoods that were farmland a few years ago. The other local peculiarity is juniper pollen, which peaks in winter rather than spring.
Limestone dust from constant grading
The bedrock is limestone and the region keeps breaking ground, so fine pale dust lifts and settles on glass across whole subdivisions, not just the lots being built. It is alkaline and holds on. Ask where the nearest active site is, because the interval for a house beside one is completely different.
Juniper pollen in winter
The local juniper — usually called cedar — releases pollen in the cool months, so the pollen season here does not line up with the spring timing used elsewhere. A visit scheduled for April misses it entirely. Ask the contractor what they know about the winter pollen load.
Heavy rain that sets the film
Fifty inches a year sounds like free cleaning, but each storm wets whatever has already settled and the sun dries it in place. Windows often look worse after a wet week. Ask how the contractor removes the film rather than relying on weather.
Hail and storm season
Spring storms bring hail, which damages screens and can pit older glass. A clean window before the season makes any damage attributable. Ask for screen and glass condition to be recorded before work.
Newly built housing and its coatings
Two-thirds of the stock postdates 1980 and much of it is very recent, which means low-emissivity coatings that react badly to ammonia, abrasives and dry scraping. Ask whether the glass is coated before any chemistry is chosen.
What to pin down in the estimate
Where this page stops
No prices are quoted and no property is assessed here. Hail damage, coating damage and etched glass are findings that need inspection at the window.
Nashville metro context
The 2024 ACS 5-year estimates describe about 2.08 million residents in 829,134 households and 897,206 housing units, with 65.2% owner-occupied and 64.0% single-family detached. About 31.7% of units predate 1980. At the Nashville Intl Ap reference station January averages 39.6°F and July 80.7°F, on 50.5 inches of annual precipitation.
Nashville reference station and housing indicators
| Indicator | Value | Source |
|---|---|---|
| January mean temperature | 39.6°F | NOAA NCEI |
| July mean temperature | 80.7°F | NOAA NCEI |
| Annual precipitation | 50.5 in. | NOAA NCEI |
| Metro population | 2,079,596 | U.S. Census Bureau |
| Owner-occupied share | 65.2% | U.S. Census Bureau |
| Housing units built before 1980 | 31.7% | U.S. Census Bureau |
Station normals are historical averages for one location, not a forecast. Glass condition depends on how often the surface is wetted and what the water carries.
Frequently Asked Questions
Why is there pale dust everywhere?
Limestone ground being graded. It settles across a wide area rather than only at the site.
When is pollen season here?
Partly in winter, because of juniper. A spring-only schedule misses it.
Is cleaning safe for new windows?
With the coating in mind. Ammonia and abrasives can damage low-emissivity glass permanently.
Why do windows look worse after rain?
Rain wets the dust and the sun bakes it on. Storms move the film rather than removing it.
Does hail damage windows?
It tears screens and can pit older glass. A recent clean makes the damage easier to attribute.
Do I need to be home?
Exterior work can usually be done unattended with agreed access. Interior work needs someone present.
Sources and review date
- American Community Survey 2024 5-year estimates (CBSA tables) — U.S. Census Bureau, 2024 ACS 5-year estimates.
- 1991–2020 station normals — NASHVILLE INTL AP, TN US (USW00013897) — NOAA National Centers for Environmental Information, 1991–2020 climate normals.
Reviewed on 2026-11-18.
Other Home Services in Nashville-Davidson–Murfreesboro–Franklin
All guides for the Nashville-Davidson–Murfreesboro–Franklin metro area