
Phoenix, AZ · metro guide
Landscaping in Phoenix: Water, Heat, and What to Compare
Phoenix landscaping is designed around water. The plan should say how plants survive July and how irrigation is measured and controlled.
Metro snapshot
Phoenix in numbers
Sources named below each block
- Population
- 5.0M
- Households
- 1.9M
- Housing units
- 2.1M
- People / household
- 2.66
- population ÷ households
Owner-occupied homes 67%
The rest are rented. Owners are the ones who commission most exterior work.
Single-family detached 65%
Detached houses carry their own roof, gutters and exterior walls.
Built before 1980 27%
Older housing stock shapes what fails first: gutters, flashing, pipe material.
Season
The year in Phoenix
- Precipitation
- 7.2 in
- Snowfall
- —
Average temperature by month, °F — the shape of the year is what decides when exterior work gets done.
Precipitation by month, inches.
| Month | Average temperature (°F) | Precipitation (in) | Snowfall (in) |
|---|---|---|---|
| January | 56.8°F | 0.87 in | — |
| February | 59.9°F | 0.87 in | — |
| March | 66.3°F | 0.83 in | — |
| April | 73.2°F | 0.22 in | — |
| May | 82.0°F | 0.13 in | — |
| June | 91.4°F | 0.02 in | — |
| July | 95.5°F | 0.91 in | — |
| August | 94.4°F | 0.93 in | — |
| September | 89.2°F | 0.57 in | — |
| October | 77.4°F | 0.56 in | — |
| November | 65.1°F | 0.57 in | — |
| December | 55.8°F | 0.74 in | — |
NOAA 1991–2020 climate normals, station PHOENIX SKY HARBOR INTL AP, AZ US (USW00023183). Station observations, not a metro-wide average — a metro that spans a mountain range can differ by more than this record shows.
Population, households and housing shares: U.S. Census Bureau, American Community Survey 2024 5-year estimates, metropolitan statistical area.
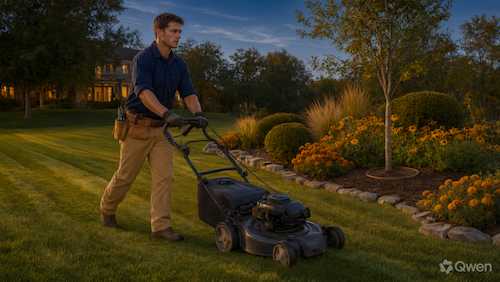
Phoenix gets about 7.2 inches of rain a year, and July at Sky Harbor averages 95.5°F. Nothing in a landscape here survives on rainfall alone, so the design is really a water plan with plants attached. The proposals worth comparing are the ones that explain irrigation, grading, and shade in specific terms.
Plants matched to the exposure
Ask which plants are proposed and why they suit the spot: full sun and reflected heat from a wall is a different condition from filtered shade. Desert-adapted species generally establish with less water, but they still have a temperature range and a soil preference. A plant list without those reasons is a shopping list.
Irrigation that can be measured
Ask how zones are divided, what emitter or drip layout is proposed, and whether the controller can be adjusted seasonally. Ask how many gallons per week the plan expects at maturity, and whether the installer will set and document the initial schedule. A system nobody knows how to adjust is usually running too much or too little.
Grading and hardscape
Even in a dry climate, a single storm can move a lot of water. Ask how the plan grades away from the foundation, where water is directed, and how hardscape joints and edges handle runoff. Reflected heat from paving also affects nearby planting, so surfaces and plants should be planned together.
The first summer and after
Establishment is the hard part. Ask who is responsible for watering and adjustment during the first season, what the schedule is, and whether replacement of failed plants is included. Clarify pruning expectations and whether maintenance continues after installation.
Questions to ask before approving a plan
Where this page stops
This page does not design a landscape or estimate cost for a specific property. Plant suitability, water-use rules, and permit requirements vary by city and by site, and should be confirmed locally.
Phoenix metro context
The 2024 ACS 5-year estimates put the metro at about 5.0 million residents and 1.9 million households. About 66.6% of occupied homes are owner-occupied, and about 65.3% of housing units are single-family detached, so most landscaping happens on private lots. NOAA's Sky Harbor station records January averaging 56.8°F, July 95.5°F, and about 7.2 inches of precipitation a year.
Phoenix reference station and housing indicators
| Indicator | Value | Source |
|---|---|---|
| January mean temperature | 56.8°F | NOAA NCEI |
| July mean temperature | 95.5°F | NOAA NCEI |
| Annual precipitation | 7.2 in. | NOAA NCEI |
| Metro population | 5,028,754 | U.S. Census Bureau |
| Owner-occupied share | 66.6% | U.S. Census Bureau |
| Single-family detached share | 65.3% | U.S. Census Bureau |
Station normals are historical averages for one location, not a forecast. Census values describe the metro area, not an individual property.
Frequently Asked Questions
What should a Phoenix landscaping estimate include?
Ask for the plan drawing, plant list with sizes, soil preparation, mulch, irrigation layout and controller, grading, hardscape, disposal, a schedule, exclusions, and the establishment or warranty terms.
How much water does a desert landscape need?
It depends on the plant mix, sizes, soil, and season, and new plantings need more than established ones. Ask the plan to state an expected weekly volume at maturity and how the controller schedule should change through the year.
Should irrigation be on a timer?
A fixed schedule is a starting point, not a plan. Ask for a controller that can be adjusted seasonally and for the initial schedule to be set and documented at handover.
Do I need approval for landscaping changes?
Some cities and homeowners associations have rules about plant lists, water use, or hardscape coverage. Confirm with the local authority and any association before work starts.
Who replaces plants that die in the first year?
It depends on the contract. Ask whether replacement is included, for how long, and under what conditions, such as proper watering or maintenance by the owner.
What is the population of the Phoenix metro area?
The U.S. Census Bureau's 2024 ACS 5-year estimates report about 5.0 million residents in the metro area. The figure describes regional scale, not the number of homes or providers.
Sources and review date
- American Community Survey 2024 5-year estimates (CBSA tables) — U.S. Census Bureau, 2024 ACS 5-year estimates.
- 1991–2020 station normals — PHOENIX SKY HARBOR INTL AP, AZ US (USW00023183) — NOAA National Centers for Environmental Information, 1991–2020 climate normals.
Reviewed on 2026-11-17.