
Austin, TX · metro guide
Solar Panels in Austin: Strong Sun and Hard Hail
Austin has the sun, and it has the hail. The proposal has to answer for both.
Metro snapshot
Austin in numbers
Sources named below each block
- Population
- 2.4M
- Households
- 989K
- Housing units
- 1.0M
- People / household
- 2.45
- population ÷ households
Owner-occupied homes 58%
The rest are rented. Owners are the ones who commission most exterior work.
Single-family detached 59%
Detached houses carry their own roof, gutters and exterior walls.
Built before 1980 19%
Older housing stock shapes what fails first: gutters, flashing, pipe material.
Season
The year in Austin
- Precipitation
- 36.2 in
- Snowfall
- 0.2 in
Average temperature by month, °F — the shape of the year is what decides when exterior work gets done.
Precipitation by month, inches.
Snowfall by month, inches.
| Month | Average temperature (°F) | Precipitation (in) | Snowfall (in) |
|---|---|---|---|
| January | 52.2°F | 2.64 in | 0.0 in |
| February | 56.1°F | 1.89 in | 0.2 in |
| March | 62.8°F | 2.88 in | 0.0 in |
| April | 69.6°F | 2.42 in | 0.0 in |
| May | 76.8°F | 5.04 in | 0.0 in |
| June | 83.0°F | 3.68 in | 0.0 in |
| July | 85.8°F | 1.96 in | 0.0 in |
| August | 86.5°F | 2.74 in | 0.0 in |
| September | 80.8°F | 3.45 in | 0.0 in |
| October | 71.6°F | 3.91 in | 0.0 in |
| November | 61.0°F | 2.92 in | 0.0 in |
| December | 53.6°F | 2.72 in | 0.0 in |
NOAA 1991–2020 climate normals, station AUSTIN-CAMP MABRY, TX US (USW00013958). Station observations, not a metro-wide average — a metro that spans a mountain range can differ by more than this record shows.
Population, households and housing shares: U.S. Census Bureau, American Community Survey 2024 5-year estimates, metropolitan statistical area.
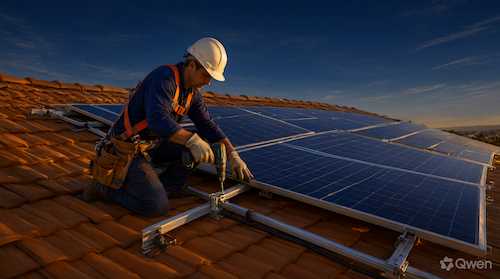
Austin's solar resource is strong, and its weather is not gentle. July averages 85.8°F, summer heat reduces module efficiency, and spring storms bring hail that can damage glass and racking. With about 19.2% of metro housing units built before 1980, according to ACS estimates, most roofs are relatively new — but age is not condition, and the equipment has to be specified for the storms.
Production in high heat
Ask which production model was used and whether it accounts for temperature derating, soiling, and the way panels lose efficiency as they heat up. Ask for estimated production by month. A system sized on a cool-climate assumption will underperform in August, and the estimate should show that rather than hide it in an annual figure.
Hail ratings and who pays
Ask what impact rating the modules and racking carry and what documentation supports it. Ask how hail damage is covered: manufacturer warranty, workmanship warranty, or property insurance. A warranty that excludes hail is not a hail warranty, and the answer should be in writing.
Roof condition and mounting
Ask how the installer evaluates roof condition, how penetrations are flashed and sealed, and who pays for removal and reinstallation if the roof is replaced. That cost is usually excluded from both the solar contract and the roof warranty.
Storage and outage expectations
Ask what the battery can carry during an outage and for how long, where it will sit, and how the main panel accommodates it. In a hot climate the battery's location affects performance and life. Ask how the system behaves in the evening and during a multi-day outage.
Questions to ask before signing
Where this page stops
This page does not estimate production, savings, or payback for a specific property and does not confirm which incentives or utility rules apply. Those depend on the roof, shading, equipment, and current tariff and tax rules, which should be checked with the relevant official source.
Austin metro context
The 2024 ACS 5-year estimates put the metro at about 2.4 million residents and 989,000 households. About 58.3% of occupied homes are owner-occupied, and about 59.0% of housing units are single-family detached, the segment where rooftop solar is most common. About 19.2% of housing units were built before 1980. NOAA's Austin station records January averaging 52.2°F, July 85.8°F, and about 36.2 inches of precipitation a year.
Austin reference station and housing indicators
| Indicator | Value | Source |
|---|---|---|
| January mean temperature | 52.2°F | NOAA NCEI |
| July mean temperature | 85.8°F | NOAA NCEI |
| Annual precipitation | 36.2 in. | NOAA NCEI |
| Metro population | 2,426,592 | U.S. Census Bureau |
| Owner-occupied share | 58.3% | U.S. Census Bureau |
| Single-family detached share | 59.0% | U.S. Census Bureau |
Station normals are historical averages for one location, not a forecast. Census values describe the metro area, not an individual property.
Frequently Asked Questions
What should I compare between solar quotes in Austin?
Compare the gross cash price, system size, equipment models and impact ratings, monthly production estimates, roof attachment details, what covers hail damage, included electrical work, exclusions, and each warranty.
Does heat reduce solar production?
Yes. Modules lose efficiency as they heat up, so a hot Austin roof produces less than the same array would in a cooler climate. Ask how the estimate accounts for temperature.
Can panels survive Texas hail?
Modules are tested to impact standards and many carry a hail rating, but severe storms can still cause damage. Ask what rating the equipment carries and what covers damage afterwards.
Should I fix my roof before installing solar?
If the roof is near the end of its service life, it is usually cheaper to address it first. Ask how condition is evaluated and who pays for removal and reinstallation later.
Who handles permits and utility interconnection?
It varies by contract. Ask which party prepares the permit and interconnection application, who schedules inspections, and who confirms permission to operate.
What is the population of the Austin metro area?
The U.S. Census Bureau's 2024 ACS 5-year estimates report about 2.4 million residents in the metro area. The figure describes regional scale, not the number of homes or providers.
Sources and review date
- American Community Survey 2024 5-year estimates (CBSA tables) — U.S. Census Bureau, 2024 ACS 5-year estimates.
- 1991–2020 station normals — AUSTIN-CAMP MABRY, TX US (USW00013958) — NOAA National Centers for Environmental Information, 1991–2020 climate normals.
Reviewed on 2026-11-18.