
Columbus, OH · metro guide
HVAC in Columbus: Cold Winters and Humid July
Columbus needs real heating capacity in January and real moisture removal in July, often in a house built before either was standard.
Metro snapshot
Columbus in numbers
Sources named below each block
- Population
- 2.2M
- Households
- 865K
- Housing units
- 926K
- People / household
- 2.52
- population ÷ households
Owner-occupied homes 61%
The rest are rented. Owners are the ones who commission most exterior work.
Single-family detached 61%
Detached houses carry their own roof, gutters and exterior walls.
Built before 1980 48%
Older housing stock shapes what fails first: gutters, flashing, pipe material.
Season
The year in Columbus
- Precipitation
- 41.6 in
- Snowfall
- 28.2 in
Average temperature by month, °F — the shape of the year is what decides when exterior work gets done.
Precipitation by month, inches.
Snowfall by month, inches.
| Month | Average temperature (°F) | Precipitation (in) | Snowfall (in) |
|---|---|---|---|
| January | 29.6°F | 3.00 in | 9.5 in |
| February | 32.5°F | 2.41 in | 7.6 in |
| March | 41.6°F | 3.62 in | 4.1 in |
| April | 53.2°F | 3.85 in | 0.5 in |
| May | 63.3°F | 3.99 in | 0.0 in |
| June | 71.9°F | 4.33 in | 0.0 in |
| July | 75.4°F | 4.67 in | 0.0 in |
| August | 74.0°F | 3.74 in | 0.0 in |
| September | 67.2°F | 3.14 in | 0.0 in |
| October | 55.2°F | 2.90 in | 0.2 in |
| November | 43.6°F | 2.79 in | 1.2 in |
| December | 34.5°F | 3.13 in | 5.1 in |
NOAA 1991–2020 climate normals, station COLUMBUS PORT COLUMBUS INTL AP, OH US (USW00014821). Station observations, not a metro-wide average — a metro that spans a mountain range can differ by more than this record shows.
Population, households and housing shares: U.S. Census Bureau, American Community Survey 2024 5-year estimates, metropolitan statistical area.
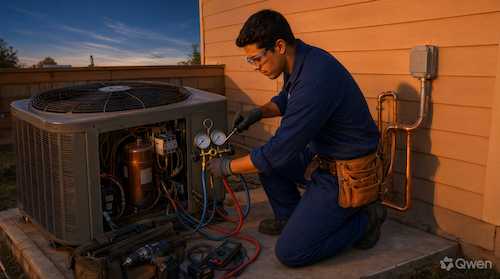
Columbus runs both halves of an HVAC system hard. January averages 29.6°F with colder nights, while July averages 75.4°F with 4.67 inches of rain — hot enough to need cooling and humid enough that moisture removal matters as much as temperature. About 47.7% of metro housing units were built before 1980, according to ACS estimates, so many houses were built around a furnace and later retrofitted for air.
Sizing for both seasons
Ask whether a load calculation was performed and what it assumed about insulation, windows, and duct location. A system sized for the coldest night can be oversized for cooling, and an oversized unit cools quickly without removing enough humidity. The two seasons pull the design in different directions.
Distribution in retrofitted houses
Ask how the system delivers air to each room: new ducts, mini-split heads, or a high-velocity system. In older homes, duct runs may have to pass through closets, soffits, or a finished attic. Ask where equipment and lines will physically go before discussing efficiency ratings.
Basements and equipment location
Many homes here have furnaces and air handlers in a basement. Ask how equipment is protected from damp, whether the flue and combustion air arrangement is appropriate, and how condensate is routed. A damp basement shortens equipment life and can create venting problems.
Maintenance and measurements
Ask what a maintenance visit includes: filter, coil cleaning, drain check, combustion or refrigerant measurements, and a written record. Ask what measurements support any repair recommendation. A proposal that recommends replacement without readings is not a diagnosis.
Questions to ask before you decide
Where this page stops
This page does not diagnose an HVAC system remotely and does not publish local prices. Equipment selection, combustion safety, refrigerant handling, and permit requirements must be confirmed on site by a qualified professional and the responsible local authority.
Columbus metro context
The 2024 ACS 5-year estimates put the metro at about 2.2 million residents and 865,000 households. About 61.3% of occupied homes are owner-occupied, and about 61.0% of housing units are single-family detached. About 47.7% of housing units were built before 1980, so many systems were retrofitted rather than designed in. NOAA's Columbus station records January averaging 29.6°F, July 75.4°F, and about 41.6 inches of precipitation a year.
Columbus reference station and housing indicators
| Indicator | Value | Source |
|---|---|---|
| January mean temperature | 29.6°F | NOAA NCEI |
| July mean temperature | 75.4°F | NOAA NCEI |
| July precipitation | 4.67 in. | NOAA NCEI |
| Annual precipitation | 41.6 in. | NOAA NCEI |
| Metro population | 2,175,788 | U.S. Census Bureau |
| Housing units built before 1980 | 47.7% | U.S. Census Bureau |
Station normals are historical averages for one location, not a forecast. Census values describe the metro area, not an individual property.
Frequently Asked Questions
How do I compare HVAC quotes in Columbus?
Compare the load calculation, equipment models and capacities for both seasons, distribution method, duct or line routing, electrical work, permit handling, startup measurements, exclusions, and warranties.
Why does my house feel clammy in summer?
Oversizing, short runtime, low airflow, duct leakage, or a fan that runs continuously can all leave moisture in the air. Ask for measurements of indoor humidity and airflow before deciding on equipment changes.
Can an older Columbus house get central air?
Often it can, but where the ducts run is the design problem. Some homes use a conventional system, others use mini-split heads or a high-velocity system.
Is a basement furnace a problem?
It can be, if the space is damp or the venting is not appropriate. Ask how the equipment is protected and whether the flue and combustion air were evaluated.
Does a new system require a permit?
Requirements depend on the work and the jurisdiction. Confirm with the authority responsible for the address and ask whether permit handling and inspection are included.
What is the population of the Columbus metro area?
The U.S. Census Bureau's 2024 ACS 5-year estimates report about 2.2 million residents in the metro area. The figure describes regional scale, not the number of homes or providers.
Sources and review date
- American Community Survey 2024 5-year estimates (CBSA tables) — U.S. Census Bureau, 2024 ACS 5-year estimates.
- 1991–2020 station normals — COLUMBUS PORT COLUMBUS INTL AP, OH US (USW00014821) — NOAA National Centers for Environmental Information, 1991–2020 climate normals.
Reviewed on 2026-11-18.