
Providence, RI-MA · metro guide
Solar Panels in Providence: Old Panels, Steep Roofs, Real Shade
Rhode Island electricity is expensive enough that rooftop solar pays attention here — but the electrical service and the trees decide more than the panels do.
Metro snapshot
Providence in numbers
Sources named below each block
- Population
- 1.7M
- Households
- 675K
- Housing units
- 731K
- People / household
- 2.49
- population ÷ households
Owner-occupied homes 63%
The rest are rented. Owners are the ones who commission most exterior work.
Single-family detached 55%
Detached houses carry their own roof, gutters and exterior walls.
Built before 1980 70%
Older housing stock shapes what fails first: gutters, flashing, pipe material.
Season
The year in Providence
- Precipitation
- 47.5 in
- Snowfall
- 36.6 in
Average temperature by month, °F — the shape of the year is what decides when exterior work gets done.
Precipitation by month, inches.
Snowfall by month, inches.
| Month | Average temperature (°F) | Precipitation (in) | Snowfall (in) |
|---|---|---|---|
| January | 30.2°F | 3.96 in | 10.3 in |
| February | 32.0°F | 3.44 in | 10.5 in |
| March | 38.9°F | 4.90 in | 6.4 in |
| April | 49.3°F | 4.29 in | 0.6 in |
| May | 59.1°F | 3.37 in | 0.0 in |
| June | 68.2°F | 3.81 in | 0.0 in |
| July | 74.4°F | 2.91 in | 0.0 in |
| August | 73.0°F | 3.59 in | 0.0 in |
| September | 65.6°F | 4.17 in | 0.0 in |
| October | 54.4°F | 4.18 in | 0.2 in |
| November | 44.5°F | 4.27 in | 1.0 in |
| December | 35.5°F | 4.65 in | 7.6 in |
NOAA 1991–2020 climate normals, station PROVIDENCE T F GREEN AP, RI US (USW00014765). Station observations, not a metro-wide average — a metro that spans a mountain range can differ by more than this record shows.
Population, households and housing shares: U.S. Census Bureau, American Community Survey 2024 5-year estimates, metropolitan statistical area.
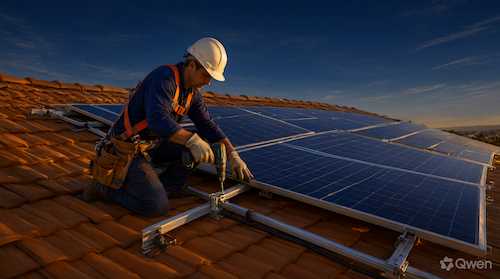
Rhode Island has some of the highest retail electricity rates in the contiguous states, and the state runs a fixed-price tariff program for small-scale solar, so rooftop systems are far more common here than the metro's size would suggest. That also means the market is crowded and the differences between quotes are not usually in the modules. On a stock where seven in ten houses predate 1980, the constraints that decide whether a system works sit in the basement and in the canopy: an undersized service, an old panel with no space for a two-pole breaker, and street trees that were planted long before anyone thought about shading a roof.
The electrical service is the first gate
A solar inverter has to be connected through the service panel, and many of these houses still run a 100-amp service with a fuse box or a panel that has no spare positions. An electrician has to establish whether the busbar rating allows the required breaker, and if it does not, the answer is a service upgrade before the array — a permit, a utility disconnect and real money. Ask every bidder what they found at the panel, what the calculated busbar allowance is, and whether a service upgrade is inside or outside their price.
Steep gables, small planes and roof age
The classic three-decker and the East Side Victorians have steep pitches and roof planes broken up by dormers, valleys and chimneys, which limits how many modules fit and complicates the mounting. More importantly, a roof that is near the end of its life should be replaced before the array goes on, because removing and reinstalling panels later costs far more than doing the roof first. Ask for the age of the covering, what the mounting penetrations will be sealed with, and how the layout handles the valleys rather than skipping them.
Mature street trees and winter shade
This is an old, densely planted metro, and the trees that make the neighborhoods attractive are also the main reason production estimates disappoint. Shade is worse in winter, when the sun is low and the bare canopy still blocks the south sky, and it is worse again on a narrow lot with a building close to the south. A production estimate without a shade study is a guess. Ask how shading was measured, whether the design uses module-level electronics to limit the loss from a shaded corner, and what the estimate assumes about future tree growth.
Snow, ice and the shoulder months
A steep roof sheds snow on its own, which is good for production and bad for anything below the eave — a walkway, a parked car, a neighbor's porch. Snow also arrives in the months when the days are shortest, so a system that looks strong on an annual figure can be quiet from December into February. Ask what the monthly production curve looks like, where snow will land, and whether the equipment is rated for the cold the site actually sees.
What to pin down in the estimate
Where this page stops
No system sizes, prices or production figures are quoted here, and no roof or electrical service is assessed. Program terms, tariffs and interconnection rules change, so current rules should be confirmed with the utility and the state authorities rather than taken from any page, including this one.
Providence metro context
The 2024 ACS 5-year estimates describe about 1.68 million residents in 675,395 households and 730,957 housing units, with 63.2% owner-occupied and 54.7% single-family detached — so a meaningful share of roofs here belong to a multi-family building where the decision involves more than one owner. About 70.0% of units predate 1980, which is why service capacity and roof age come up in almost every quote. No climate station is reported for this metro in the site dataset, so no temperature or precipitation normals appear on this page.
Providence housing indicators
| Indicator | Value | Source |
|---|---|---|
| Housing units built before 1980 | 70.0% | U.S. Census Bureau |
| Single-family detached share | 54.7% | U.S. Census Bureau |
| Owner-occupied share | 63.2% | U.S. Census Bureau |
| Metro households | 675,395 | U.S. Census Bureau |
| Housing units | 730,957 | U.S. Census Bureau |
| Metro population | 1,684,071 | U.S. Census Bureau |
No climate normals are shown because no station record is held for this metro in the site dataset. Snow shading and coastal cloud cover differ across the metro, so production should be modelled per site rather than per metro.
Frequently Asked Questions
Do I have to upgrade my electrical service to go solar?
Not always, but it is the most common blocker on this housing stock. It depends on the rating of the existing panel and the allowance for the solar breaker; an electrician has to make that call on site, and the answer should appear in writing in the quote.
How much does the shade from street trees matter?
Enough that it decides the design. A shaded module produces far less than its rating, and shade is heaviest in the low winter sun. A quote without a shade study, or without module-level electronics that limit the loss, is estimating rather than designing.
Should I replace the roof first?
If the covering has limited life left, yes. Removing and reinstalling an array later adds cost and labor that the original price never included, and it puts the penetration seals through a second cycle.
What happens to production when it snows?
A steep roof sheds, but the snow arrives in the shortest days of the year, so winter output is low regardless. Ask for a monthly curve so the quiet months are visible before signing rather than discovered afterwards.
Does a three-decker work for solar?
It can, but the decision involves every owner and the roof is shared. The electrical service is usually the harder question, and the agreement on who pays and who benefits has to be settled before the design.
Is a historic district a problem?
It can be. Districts review visible changes, which may include panels, conduit routing and where equipment is mounted. Confirm the review requirement before the design is finalized, because reworking a layout after the fact is expensive.
Sources and review date
- American Community Survey 2024 5-year estimates (CBSA tables) — U.S. Census Bureau, 2024 ACS 5-year estimates.
Reviewed on 2026-11-18.