
St. Louis, MO-IL · metro guide
Water Damage Restoration in St. Louis: Basements and Burst Pipes
St. Louis water damage has two signatures: a pipe that splits in a cold snap, and a basement that fills when the ground cannot take more rain.
Metro snapshot
St. Louis in numbers
Sources named below each block
- Population
- 2.8M
- Households
- 1.2M
- Housing units
- 1.3M
- People / household
- 2.42
- population ÷ households
Owner-occupied homes 70%
The rest are rented. Owners are the ones who commission most exterior work.
Single-family detached 71%
Detached houses carry their own roof, gutters and exterior walls.
Built before 1980 58%
Older housing stock shapes what fails first: gutters, flashing, pipe material.
Season
The year in St. Louis
- Precipitation
- 41.7 in
- Snowfall
- 16.6 in
Average temperature by month, °F — the shape of the year is what decides when exterior work gets done.
Precipitation by month, inches.
Snowfall by month, inches.
| Month | Average temperature (°F) | Precipitation (in) | Snowfall (in) |
|---|---|---|---|
| January | 32.1°F | 2.59 in | 5.7 in |
| February | 36.7°F | 2.23 in | 4.3 in |
| March | 46.6°F | 3.50 in | 2.3 in |
| April | 57.5°F | 4.73 in | 0.2 in |
| May | 67.5°F | 4.82 in | 0.0 in |
| June | 76.5°F | 4.49 in | 0.0 in |
| July | 80.4°F | 3.93 in | 0.0 in |
| August | 78.8°F | 3.38 in | 0.0 in |
| September | 71.0°F | 2.96 in | 0.0 in |
| October | 59.1°F | 3.15 in | 0.0 in |
| November | 46.5°F | 3.42 in | 0.9 in |
| December | 36.5°F | 2.50 in | 3.2 in |
NOAA 1991–2020 climate normals, station ST LOUIS LAMBERT INTL AP, MO US (USW00013994). Station observations, not a metro-wide average — a metro that spans a mountain range can differ by more than this record shows.
Population, households and housing shares: U.S. Census Bureau, American Community Survey 2024 5-year estimates, metropolitan statistical area.
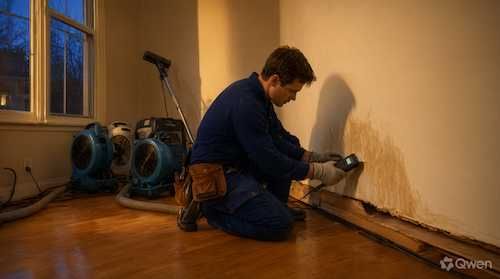
St. Louis gets about 41.7 inches of precipitation a year, and January averages 32.1°F — right at the freezing line, which is where pipes are most vulnerable. Combine that with a large share of older homes and a lot of full basements, and water damage here usually means one of two things: a supply line that froze and split, or a basement that took on water after a long wet spell.
Source first
A scope should identify whether the water came from a burst supply line, a drain backup, a basement wall, a roof, or a window, and whether it is still entering. Ask how the source was confirmed and what repair is needed before reconstruction begins. If the source is not controlled, drying equipment is treating a symptom.
Basements and recurring water
Basement water is common here, and the cause matters: a failed sump pump, a blocked drain, gutters discharging at the foundation, or groundwater pressure. Ask whether the assessment distinguishes between a one-time event and a recurring condition, because the fix is different and drying alone will not prevent the next one.
Burst pipes and the hidden extent
Ask whether the assessment looked for water that has been present for a while, not just the visible burst. A pipe that froze in January can leak slowly and release later, so the wet area may be larger than the stain suggests. Ask for moisture readings in ceilings and cavities, not only at surfaces.
Drying records
Ask for moisture readings with locations and dates, equipment placement, and the dry standard used to close the job. Ask which materials will be removed rather than dried — saturated insulation, drywall, and carpet padding rarely return to a serviceable condition.
Questions worth asking before work begins
Where this page stops
This guide does not assess an active loss remotely and does not publish local prices. If water is still entering or there is an electrical safety concern, contact the appropriate emergency service. Coverage and remediation requirements depend on the property, the policy, and the responsible local authority.
St. Louis metro context
The 2024 ACS 5-year estimates put the metro at about 2.8 million residents and 1.2 million households. About 70.4% of occupied homes are owner-occupied, and about 70.6% of housing units are single-family detached, so most basements and yards belong to the occupant. About 58.3% of housing units were built before 1980. NOAA's St. Louis station records January averaging 32.1°F, July 80.4°F, and about 41.7 inches of precipitation a year.
St. Louis reference station and housing indicators
| Indicator | Value | Source |
|---|---|---|
| January mean temperature | 32.1°F | NOAA NCEI |
| July mean temperature | 80.4°F | NOAA NCEI |
| Annual precipitation | 41.7 in. | NOAA NCEI |
| Metro population | 2,810,850 | U.S. Census Bureau |
| Owner-occupied share | 70.4% | U.S. Census Bureau |
| Housing units built before 1980 | 58.3% | U.S. Census Bureau |
Station normals are historical averages for one location, not a forecast. Census values describe the metro area, not an individual property.
Frequently Asked Questions
What should I do first after discovering water damage?
Stop the source if it is safe to do so, keep people away from electrical hazards, and document the affected area with dated photos. Then arrange an assessment of the source and the wet materials.
How do I keep a basement dry?
Grading away from the foundation, extending downspouts, and a working sump system address the usual causes. Ask whether the assessment identified why water entered rather than only removing it.
How is drying verified?
Drying is normally checked with moisture readings taken at documented locations and compared over time, along with visual inspection. Ask for the readings and the dry standard used to close the job.
Does homeowners insurance cover a frozen pipe burst?
Coverage depends on the policy, the cause, exclusions, the deductible, and the insurer's review, and freeze-related exclusions may apply if the property was unoccupied. Ask the insurer about the specific policy.
Is basement seepage covered by insurance?
Long-term seepage and groundwater are often treated differently from a sudden discharge. Ask the insurer about the specific policy before assuming coverage either way.
What is the population of the St. Louis metro area?
The U.S. Census Bureau's 2024 ACS 5-year estimates report about 2.8 million residents in the metro area. The figure describes regional scale, not the number of homes or providers.
Sources and review date
- American Community Survey 2024 5-year estimates (CBSA tables) — U.S. Census Bureau, 2024 ACS 5-year estimates.
- 1991–2020 station normals — ST LOUIS LAMBERT INTL AP, MO US (USW00013994) — NOAA National Centers for Environmental Information, 1991–2020 climate normals.
Reviewed on 2026-11-18.