
St. Louis, MO-IL · metro guide
Roofing in St. Louis: Hail, Ice, and Older Roofs
St. Louis roofs take hail in spring and ice in winter, on a housing stock where many roofs already have a history.
Metro snapshot
St. Louis in numbers
Sources named below each block
- Population
- 2.8M
- Households
- 1.2M
- Housing units
- 1.3M
- People / household
- 2.42
- population ÷ households
Owner-occupied homes 70%
The rest are rented. Owners are the ones who commission most exterior work.
Single-family detached 71%
Detached houses carry their own roof, gutters and exterior walls.
Built before 1980 58%
Older housing stock shapes what fails first: gutters, flashing, pipe material.
Season
The year in St. Louis
- Precipitation
- 41.7 in
- Snowfall
- 16.6 in
Average temperature by month, °F — the shape of the year is what decides when exterior work gets done.
Precipitation by month, inches.
Snowfall by month, inches.
| Month | Average temperature (°F) | Precipitation (in) | Snowfall (in) |
|---|---|---|---|
| January | 32.1°F | 2.59 in | 5.7 in |
| February | 36.7°F | 2.23 in | 4.3 in |
| March | 46.6°F | 3.50 in | 2.3 in |
| April | 57.5°F | 4.73 in | 0.2 in |
| May | 67.5°F | 4.82 in | 0.0 in |
| June | 76.5°F | 4.49 in | 0.0 in |
| July | 80.4°F | 3.93 in | 0.0 in |
| August | 78.8°F | 3.38 in | 0.0 in |
| September | 71.0°F | 2.96 in | 0.0 in |
| October | 59.1°F | 3.15 in | 0.0 in |
| November | 46.5°F | 3.42 in | 0.9 in |
| December | 36.5°F | 2.50 in | 3.2 in |
NOAA 1991–2020 climate normals, station ST LOUIS LAMBERT INTL AP, MO US (USW00013994). Station observations, not a metro-wide average — a metro that spans a mountain range can differ by more than this record shows.
Population, households and housing shares: U.S. Census Bureau, American Community Survey 2024 5-year estimates, metropolitan statistical area.
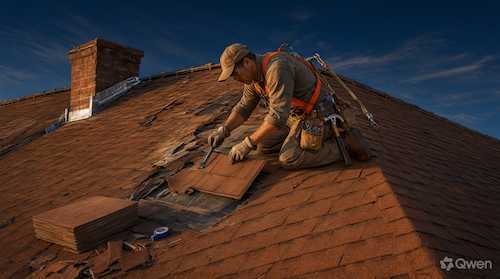
St. Louis gets about 41.7 inches of precipitation a year, with 3.93 inches in July, and January averages 32.1°F — cold enough for snow and ice at the eaves but warm enough to melt and refreeze. About 58.3% of metro housing units were built before 1980, according to ACS estimates, so many roofs have been replaced at least once and some carry more than one layer.
Layers, tear-off, and decking
Ask whether the quote is for a full tear-off or an overlay, and how many existing layers are present. Layering saves money up front and hides the deck, which is where soft spots and rot live. Ask how decking damage will be priced and approved if it is found after removal.
Ice at the eaves
Ask where ice-and-water protection is installed and how the attic is ventilated. When snow melts on a warm roof deck and refreezes at the colder edge, water backs up under the covering. Edge protection and balanced ventilation address the mechanism; a new roof over the same conditions repeats the problem.
Hail and wind documentation
Ask what impact rating the covering carries and how the contractor documents storm damage for an insurer: photographs, test squares, and a written scope that separates damage from wear. Ask whether they will meet the adjuster on site, because a claim is easier when the evidence is collected before anything is removed.
Flashing, chimneys, and valleys
Ask how flashing at chimneys, valleys, and wall junctions is handled and whether old flashing is replaced or reused. These are the details most likely to leak first and the ones most often left off a written scope. Get them itemized rather than covered by a general promise.
Questions to ask before signing
Where this page stops
This page does not inspect a roof, estimate cost, or interpret an insurance policy. Coverage and claim requirements depend on the policy and the insurer, and code requirements vary by jurisdiction and should be confirmed with the responsible local authority.
St. Louis metro context
The 2024 ACS 5-year estimates put the metro at about 2.8 million residents and 1.2 million households. About 70.4% of occupied homes are owner-occupied, and about 70.6% of housing units are single-family detached, so most roof work happens on owner-occupied houses. About 58.3% of housing units were built before 1980. NOAA's St. Louis station records January averaging 32.1°F, July 80.4°F, and about 41.7 inches of precipitation a year.
St. Louis reference station and housing indicators
| Indicator | Value | Source |
|---|---|---|
| January mean temperature | 32.1°F | NOAA NCEI |
| July mean temperature | 80.4°F | NOAA NCEI |
| Annual precipitation | 41.7 in. | NOAA NCEI |
| Metro population | 2,810,850 | U.S. Census Bureau |
| Owner-occupied share | 70.4% | U.S. Census Bureau |
| Housing units built before 1980 | 58.3% | U.S. Census Bureau |
Station normals are historical averages for one location, not a forecast. Census values describe the metro area, not an individual property.
Frequently Asked Questions
How do I compare roofing estimates in St. Louis?
Compare tear-off versus overlay, the specified covering and impact rating, underlayment and ice protection, flashing details, decking allowances, ventilation, permit handling, disposal, exclusions, and both workmanship and manufacturer warranties.
Should I tear off existing layers?
A tear-off lets the deck be inspected and usually produces a flatter, better-attached roof. Ask how many layers exist and what the difference in cost and warranty is.
What causes ice dams?
Snow melts on a warm roof deck and refreezes at the colder edge, backing water under the covering. Ventilation, air sealing, and edge protection all affect it.
How is hail damage documented?
Typically with photographs, test squares, and a written scope separating storm damage from normal wear. Ask whether the contractor will meet the adjuster on site.
Does a roof replacement require a permit?
Requirements depend on the jurisdiction and the scope. Confirm with the authority responsible for the address and ask whether permit handling and inspection are included.
What is the population of the St. Louis metro area?
The U.S. Census Bureau's 2024 ACS 5-year estimates report about 2.8 million residents in the metro area. The figure describes regional scale, not the number of homes or providers.
Sources and review date
- American Community Survey 2024 5-year estimates (CBSA tables) — U.S. Census Bureau, 2024 ACS 5-year estimates.
- 1991–2020 station normals — ST LOUIS LAMBERT INTL AP, MO US (USW00013994) — NOAA National Centers for Environmental Information, 1991–2020 climate normals.
Reviewed on 2026-11-17.