
Houston, TX · metro guide
Roofing in Houston: Heat, Rain, and What to Compare
Houston roofs alternate between heat that ages materials and rain that finds every gap. The proposal should cover both, not just the shingles.
Metro snapshot
Houston in numbers
Sources named below each block
- Population
- 7.4M
- Households
- 2.7M
- Housing units
- 2.9M
- People / household
- 2.80
- population ÷ households
Owner-occupied homes 61%
The rest are rented. Owners are the ones who commission most exterior work.
Single-family detached 62%
Detached houses carry their own roof, gutters and exterior walls.
Built before 1980 32%
Older housing stock shapes what fails first: gutters, flashing, pipe material.
Season
The year in Houston
- Precipitation
- 51.8 in
- Snowfall
- 0.1 in
Average temperature by month, °F — the shape of the year is what decides when exterior work gets done.
Precipitation by month, inches.
Snowfall by month, inches.
| Month | Average temperature (°F) | Precipitation (in) | Snowfall (in) |
|---|---|---|---|
| January | 53.8°F | 3.76 in | 0.0 in |
| February | 57.7°F | 2.97 in | 0.0 in |
| March | 63.8°F | 3.47 in | 0.0 in |
| April | 70.0°F | 3.95 in | 0.0 in |
| May | 77.4°F | 5.01 in | 0.0 in |
| June | 83.0°F | 6.00 in | 0.0 in |
| July | 85.1°F | 3.77 in | 0.0 in |
| August | 85.2°F | 4.84 in | 0.0 in |
| September | 80.5°F | 4.71 in | 0.0 in |
| October | 71.8°F | 5.46 in | 0.0 in |
| November | 62.0°F | 3.87 in | 0.0 in |
| December | 55.4°F | 4.03 in | 0.1 in |
NOAA 1991–2020 climate normals, station HOUSTON INTERCONT AP, TX US (USW00012960). Station observations, not a metro-wide average — a metro that spans a mountain range can differ by more than this record shows.
Population, households and housing shares: U.S. Census Bureau, American Community Survey 2024 5-year estimates, metropolitan statistical area.
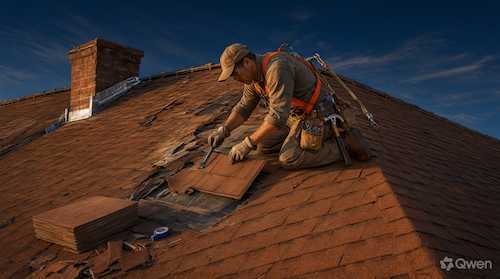
A Houston roof lives two lives. For months it bakes — July at the Intercontinental station averages 85.1°F — and then the rain arrives, about 51.8 inches in a typical year, often in heavy bursts. Heat ages underlayment and sealants; water finds the places where they have already given up. That is why a proposal focused only on the visible covering can miss the parts that are actually failing.
Drainage and flashing in a wet climate
Ask how water leaves each roof area and what happens at valleys, wall transitions, and penetrations. In a metro with this much rain, debris in valleys and blocked gutters turn a small flashing defect into a ceiling stain. A scope that replaces shingles but leaves the drainage details unchanged is likely to produce the same leak in the same place.
Heat, ventilation, and attic conditions
Sustained heat shortens the life of many roof coverings and raises attic temperatures. Ask whether the proposal includes ventilation or insulation work and how the assembly is expected to perform under long, hot summers. Ventilation is not an upgrade to skip: it affects both roof life and cooling demand.
Storm damage and documentation
After a wind or hail event, compare documented condition rather than the number of damaged shingles a contractor mentions. Ask for dated photos, a written description of affected areas, and a scope that separates storm repairs from maintenance. Keep the inspection report with any insurance claim number.
Assembly details worth naming
Ask what is removed, what underlayment is installed, how flashing is integrated, and whether deck repair is included. On older roofs, the deck may need repair once the covering is off, so ask how that work is priced — per sheet or as an allowance. Those details decide how the final price compares across proposals.
Questions to ask before approving work
Where this page stops
This page does not inspect a roof or publish local prices. Roof condition and permit requirements must be confirmed at the property and with the authority responsible for the address.
Houston metro context
The 2024 ACS 5-year estimates put the metro at about 7.4 million residents and 2.7 million households. About 61.2% of occupied homes are owner-occupied, and about 62.4% of housing units are single-family detached. Only about 31.5% of housing units were built before 1980, so the stock is younger than older metros, but rapid growth means roof ages vary widely. NOAA's station records January averaging 53.8°F, July 85.1°F, and about 51.8 inches of precipitation a year.
Houston reference station and housing indicators
| Indicator | Value | Source |
|---|---|---|
| January mean temperature | 53.8°F | NOAA NCEI |
| July mean temperature | 85.1°F | NOAA NCEI |
| Annual precipitation | 51.8 in. | NOAA NCEI |
| Metro population | 7,442,788 | U.S. Census Bureau |
| Owner-occupied share | 61.2% | U.S. Census Bureau |
| Single-family detached share | 62.4% | U.S. Census Bureau |
Station normals are historical averages for one location, not a forecast. Census values describe the metro area, not an individual property.
Frequently Asked Questions
What should a roofing proposal include in Houston?
The roof area, removal and installation scope, underlayment, flashing, drainage, ventilation, disposal, permit responsibilities, schedule, and warranty terms. Ask for exclusions in writing as well.
Why does my roof leak after heavy rain?
Heavy rain exposes flashing, underlayment, and drainage defects that stay hidden in dry weather. The source should be traced at the roof rather than inferred from a ceiling stain.
Does attic ventilation matter in a hot climate?
Yes. Sustained heat and poor ventilation can shorten roof life and raise cooling demand. Ask whether the proposal includes ventilation or insulation improvements and how they affect the assembly.
How do I document storm damage for insurance?
Keep dated photos, the inspection report, and any claim number with the proposal. Ask the contractor to separate storm repairs from maintenance items so the scope is clear.
How is deck repair handled after removal?
Ask before signing. Some proposals price deck repair per sheet, others use an allowance. The difference matters when soft spots are found once the old covering is off.
What is the population of the Houston metro area?
The U.S. Census Bureau's 2024 ACS 5-year estimates report about 7.4 million residents in the metro area. The figure describes regional scale, not the number of homes or providers.
Sources and review date
- American Community Survey 2024 5-year estimates (CBSA tables) — U.S. Census Bureau, 2024 ACS 5-year estimates.
- 1991–2020 station normals — HOUSTON INTERCONT AP, TX US (USW00012960) — NOAA National Centers for Environmental Information, 1991–2020 climate normals.
Reviewed on 2026-11-17.
Other Home Services in Houston–Pasadena–The Woodlands
All guides for the Houston–Pasadena–The Woodlands metro area