
San Antonio, TX · metro guide
Roofing in San Antonio: Hail, Attic Heat and Insurance Claims
The roof is more likely to be damaged by hail than to wear out — and the damage is invisible from the ground.
Metro snapshot
San Antonio in numbers
Sources named below each block
- Population
- 2.7M
- Households
- 967K
- Housing units
- 1.1M
- People / household
- 2.75
- population ÷ households
Owner-occupied homes 63%
The rest are rented. Owners are the ones who commission most exterior work.
Single-family detached 66%
Detached houses carry their own roof, gutters and exterior walls.
Built before 1980 33%
Older housing stock shapes what fails first: gutters, flashing, pipe material.
Season
The year in San Antonio
- Precipitation
- 32.4 in
- Snowfall
- 0.2 in
Average temperature by month, °F — the shape of the year is what decides when exterior work gets done.
Precipitation by month, inches.
Snowfall by month, inches.
| Month | Average temperature (°F) | Precipitation (in) | Snowfall (in) |
|---|---|---|---|
| January | 52.2°F | 1.96 in | 0.0 in |
| February | 56.3°F | 1.74 in | 0.1 in |
| March | 62.8°F | 2.31 in | 0.0 in |
| April | 69.4°F | 2.42 in | 0.0 in |
| May | 76.5°F | 4.40 in | 0.0 in |
| June | 82.6°F | 3.28 in | 0.0 in |
| July | 84.8°F | 2.41 in | 0.0 in |
| August | 85.5°F | 2.15 in | 0.0 in |
| September | 79.9°F | 3.88 in | 0.0 in |
| October | 71.3°F | 3.75 in | 0.0 in |
| November | 60.7°F | 2.08 in | 0.0 in |
| December | 53.5°F | 2.00 in | 0.1 in |
NOAA 1991–2020 climate normals, station SAN ANTONIO INTL AP, TX US (USW00012921). Station observations, not a metro-wide average — a metro that spans a mountain range can differ by more than this record shows.
Population, households and housing shares: U.S. Census Bureau, American Community Survey 2024 5-year estimates, metropolitan statistical area.
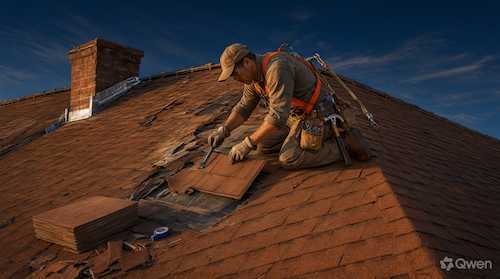
San Antonio sits in one of the most hail-prone parts of the country, and that single fact organizes the roofing market here. Hail bruises the mat of an asphalt shingle, knocks granules loose and shortens its life without necessarily tearing the surface — so a roof can look acceptable from the driveway and still be at the end of its service life two summers later. Add a July mean of 84.8°F at the reference station, a long cooling season and an attic that becomes a furnace, and the two forces working on a roof here are impact from above and heat from below.
What hail actually does
The visible evidence is granule loss, dents in the soft metal — vents, valleys, gutter aprons, the caps on a ridge — and bruising that shows as a soft spot when the shingle is felt by hand. That is why an inspection from the ground proves nothing, and why the condition of the roof should be documented before it is replaced rather than after. Ask whether the contractor inspects the metal components as well as the shingles, how the damage will be photographed and recorded, and whether they will meet the adjuster on the roof.
Attic heat, ventilation and the radiant barrier
In this climate the attic is the second roof problem. A dark shingle covering over an under-vented attic raises the temperature of everything inside it, including the ductwork and the insulation, and the air conditioning pays for that all evening. Radiant barriers and improved ventilation are the standard responses, and both are far cheaper to install during a replacement than afterwards. Ask whether the deck will be evaluated for a radiant barrier, how intake and exhaust ventilation are balanced, and whether the ducts will be inspected while the roof is open.
Wind, and the details it finds
Wind damage concentrates at the perimeter: ridge and hip caps, rake edges, and the first courses at the eave. It also finds anything that was already loose, which is why a roof that survived several storms can lose a ridge cap in the next one. The difference between two quotes is often in those details rather than in the shingle. Ask what the nailing pattern is, how the edge metal and ridge are specified, and whether the deck will be inspected and re-nailed while it is exposed.
The claim and the code items
Because so much work here is insurance-driven, the documentation matters as much as the installation. Photographs, a written scope, and a clear separation between storm damage and ordinary wear are what an adjuster needs, and code-required items — decking, flashing, ventilation upgrades — are sometimes treated separately from the damage itself. Ask how the scope distinguishes damage from code upgrades, who communicates with the insurer, and what happens if the approved scope is less than the roof needs.
What is found under the shingles
In hail country the deck matters as much as the covering. Re-decking is sometimes needed where panels have been weakened by moisture, and the condition of the decking decides whether the new roof performs. A radiant barrier is also cheapest to install at this moment. Ask whether the deck will be inspected and repaired as part of the scope, whether damaged panels are replaced or merely covered, and whether a radiant barrier is included or quoted separately.
What to pin down in the estimate
Where this page stops
No prices are quoted and no roof is assessed here. Whether damage is covered, and to what extent, is the insurer's determination, and structural questions require inspection by someone qualified to judge the assembly.
San Antonio metro context
The 2024 ACS 5-year estimates describe about 2.66 million residents in 967,488 households and 1,057,823 housing units, with 63.3% owner-occupied and 66.1% single-family detached. About 32.7% of units predate 1980. At the San Antonio reference station, January averages 52.2°F and July 84.8°F, on 32.4 inches of annual precipitation with small amounts of snow in an average year.
San Antonio reference station and housing indicators
| Indicator | Value | Source |
|---|---|---|
| January mean temperature | 52.2°F | NOAA NCEI |
| July mean temperature | 84.8°F | NOAA NCEI |
| Annual precipitation | 32.4 in. | NOAA NCEI |
| Metro population | 2,662,733 | U.S. Census Bureau |
| Owner-occupied share | 63.3% | U.S. Census Bureau |
| Housing units built before 1980 | 32.7% | U.S. Census Bureau |
Station normals are historical averages for one location, not a forecast. The long cooling season shown here is what makes attic heat a roofing issue, and hail risk is a separate exposure that no average can express.
Frequently Asked Questions
How do I know if my shingles were damaged by hail?
By inspection on the roof — granule loss, bruising that feels soft, and dents in the soft metal. From the ground you can see almost none of it, which is why the inspection has to happen before anything is removed.
Will insurance pay for a full replacement?
That is the insurer's determination, based on the documented damage, the age of the roof and the policy. What you can control is the quality of the evidence: photographs, a written scope and a clear distinction between damage and wear.
What is a radiant barrier and is it worth it?
It is a reflective layer that reduces radiant heat transfer into the attic. In a climate with a long cooling season it is usually worth discussing during a replacement, when the deck is accessible.
Should I upgrade ventilation during a roof replacement?
If the attic is under-vented, yes — it is far cheaper while the roof is open. Balanced intake and exhaust also protect the new covering, since heat and moisture shorten its life.
Do I have to use the contractor my insurer recommends?
No, though the insurer may have requirements about documentation and scope. What matters is that the contractor will document the damage properly and communicate with the adjuster.
Why did only the ridge caps come off in the wind?
Because the perimeter is where wind loads concentrate and where the attachments are most exposed. Ridge, hip and rake details are worth specifying explicitly rather than leaving to a default.
Sources and review date
- American Community Survey 2024 5-year estimates (CBSA tables) — U.S. Census Bureau, 2024 ACS 5-year estimates.
- 1991–2020 station normals — SAN ANTONIO INTL AP, TX US (USW00012921) — NOAA National Centers for Environmental Information, 1991–2020 climate normals.
Reviewed on 2026-11-18.