
Austin, TX · metro guide
Electrical in Austin: New Homes, Growing Loads
Austin's panels are young, but the load behind them keeps growing as cooling, driving, and heating electrify.
Metro snapshot
Austin in numbers
Sources named below each block
- Population
- 2.4M
- Households
- 989K
- Housing units
- 1.0M
- People / household
- 2.45
- population ÷ households
Owner-occupied homes 58%
The rest are rented. Owners are the ones who commission most exterior work.
Single-family detached 59%
Detached houses carry their own roof, gutters and exterior walls.
Built before 1980 19%
Older housing stock shapes what fails first: gutters, flashing, pipe material.
Season
The year in Austin
- Precipitation
- 36.2 in
- Snowfall
- 0.2 in
Average temperature by month, °F — the shape of the year is what decides when exterior work gets done.
Precipitation by month, inches.
Snowfall by month, inches.
| Month | Average temperature (°F) | Precipitation (in) | Snowfall (in) |
|---|---|---|---|
| January | 52.2°F | 2.64 in | 0.0 in |
| February | 56.1°F | 1.89 in | 0.2 in |
| March | 62.8°F | 2.88 in | 0.0 in |
| April | 69.6°F | 2.42 in | 0.0 in |
| May | 76.8°F | 5.04 in | 0.0 in |
| June | 83.0°F | 3.68 in | 0.0 in |
| July | 85.8°F | 1.96 in | 0.0 in |
| August | 86.5°F | 2.74 in | 0.0 in |
| September | 80.8°F | 3.45 in | 0.0 in |
| October | 71.6°F | 3.91 in | 0.0 in |
| November | 61.0°F | 2.92 in | 0.0 in |
| December | 53.6°F | 2.72 in | 0.0 in |
NOAA 1991–2020 climate normals, station AUSTIN-CAMP MABRY, TX US (USW00013958). Station observations, not a metro-wide average — a metro that spans a mountain range can differ by more than this record shows.
Population, households and housing shares: U.S. Census Bureau, American Community Survey 2024 5-year estimates, metropolitan statistical area.
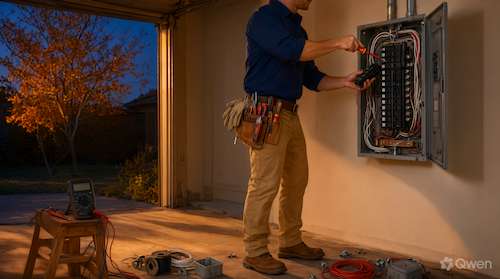
Only about 19.2% of Austin metro housing units were built before 1980, according to ACS estimates, so antique wiring is rare here. The pressure is growth instead: a fast-growing metro keeps adding load to a service — an EV charger, a heat pump, a pool, a detached garage shop — that was sized for a house with fewer machines and a shorter list of appliances.
Capacity is a calculation
Ask what the existing service rating is and whether a load calculation was done for the proposed change. A Level 2 charger is a large continuous load, and a heat pump with auxiliary heat adds more. The answer may be load management, a dedicated circuit, a panel change, or a service upgrade — but it should follow a calculation.
Panel condition, not just rating
Ask what was inspected inside the panel: breaker condition, bus connections, grounding and bonding, and any signs of heat. A panel built to an older code may still be serviceable, and a new panel does not fix an overloaded circuit. Get the finding in writing.
Testing before replacement
Ask which tests support the diagnosis: voltage readings, circuit tracing, insulation testing, thermal imaging, or a panel inspection. Tripping breakers in August can come from a failing component, a loose connection, an undersized circuit, or genuine overload. Replacing parts without a finding often produces a repeat visit.
Permits and restoration
Ask who files the permit, who schedules the inspection, and what restoration is included after walls are opened. In newer homes that usually means drywall patching and paint; confirm whether finishing is included or left to the owner.
Questions to ask before approving work
Where this page stops
This page does not assess electrical safety remotely and does not publish local prices. Electrical hazards should be handled by a qualified professional, and permit and inspection requirements must be confirmed with the authority responsible for the address.
Austin metro context
The 2024 ACS 5-year estimates put the metro at about 2.4 million residents and 989,000 households. About 58.3% of occupied homes are owner-occupied, and about 59.0% of housing units are single-family detached. About 19.2% of housing units were built before 1980. NOAA's Austin station records January averaging 52.2°F, July 85.8°F, and about 36.2 inches of precipitation a year.
Austin reference station and housing indicators
| Indicator | Value | Source |
|---|---|---|
| January mean temperature | 52.2°F | NOAA NCEI |
| July mean temperature | 85.8°F | NOAA NCEI |
| Annual precipitation | 36.2 in. | NOAA NCEI |
| Metro population | 2,426,592 | U.S. Census Bureau |
| Owner-occupied share | 58.3% | U.S. Census Bureau |
| Housing units built before 1980 | 19.2% | U.S. Census Bureau |
Station normals are historical averages for one location, not a forecast. Census values describe the metro area, not an individual property.
Frequently Asked Questions
How do I know if my Austin home needs a panel upgrade?
The decision should follow an assessment of the service rating, panel condition, and the proposed load. Ask whether a load calculation was performed and which findings support the upgrade.
Can I add an EV charger without upgrading the service?
Sometimes, depending on existing capacity and the charger's requirements. Ask for a load calculation and a written scope covering the circuit, the breaker, and any permit or inspection step.
Why do breakers trip more in summer?
Cooling equipment runs longer and draws more. The cause should be identified with testing rather than by repeatedly resetting the breaker.
What should an electrical estimate include?
The tested condition, work area, materials, labor, permit assumptions, inspection responsibilities, restoration, exclusions, and warranty. Ask for the test results that support the recommendation.
Do I need a permit for electrical work?
Requirements depend on the type of work and the jurisdiction. Confirm with the authority responsible for the address and ask whether permit handling and inspection are included in the scope.
What is the population of the Austin metro area?
The U.S. Census Bureau's 2024 ACS 5-year estimates report about 2.4 million residents in the metro area. The figure describes regional scale, not the number of homes or providers.
Sources and review date
- American Community Survey 2024 5-year estimates (CBSA tables) — U.S. Census Bureau, 2024 ACS 5-year estimates.
- 1991–2020 station normals — AUSTIN-CAMP MABRY, TX US (USW00013958) — NOAA National Centers for Environmental Information, 1991–2020 climate normals.
Reviewed on 2026-11-18.