
San Diego, CA · metro guide
Solar Panels in San Diego: Marine Layer and Roof Type
San Diego is a strong solar market, but the coastal marine layer and the roof assembly decide what the array actually produces.
Metro snapshot
San Diego in numbers
Sources named below each block
- Population
- 3.3M
- Households
- 1.2M
- Housing units
- 1.3M
- People / household
- 2.81
- population ÷ households
Owner-occupied homes 55%
The rest are rented. Owners are the ones who commission most exterior work.
Single-family detached 50%
Detached houses carry their own roof, gutters and exterior walls.
Built before 1980 50%
Older housing stock shapes what fails first: gutters, flashing, pipe material.
Season
The year in San Diego
- Precipitation
- 9.8 in
- Snowfall
- —
Average temperature by month, °F — the shape of the year is what decides when exterior work gets done.
Precipitation by month, inches.
| Month | Average temperature (°F) | Precipitation (in) | Snowfall (in) |
|---|---|---|---|
| January | 58.4°F | 1.98 in | — |
| February | 59.0°F | 2.20 in | — |
| March | 60.7°F | 1.46 in | — |
| April | 62.9°F | 0.65 in | — |
| May | 64.8°F | 0.28 in | — |
| June | 67.2°F | 0.05 in | — |
| July | 70.7°F | 0.08 in | — |
| August | 72.4°F | 0.01 in | — |
| September | 71.7°F | 0.12 in | — |
| October | 68.1°F | 0.50 in | — |
| November | 62.7°F | 0.79 in | — |
| December | 57.9°F | 1.67 in | — |
NOAA 1991–2020 climate normals, station SAN DIEGO LINDBERGH FLD, CA US (USW00023188). Station observations, not a metro-wide average — a metro that spans a mountain range can differ by more than this record shows.
Population, households and housing shares: U.S. Census Bureau, American Community Survey 2024 5-year estimates, metropolitan statistical area.
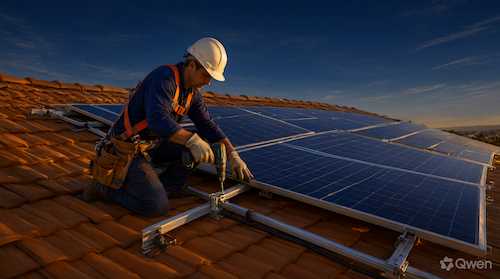
San Diego has one of the best solar resources of any large metro, and one of the most complicated roof landscapes: tile, low-slope, flat-over-living-space, and multi-level homes packed onto small lots. About 49.5% of metro housing units were built before 1980, according to ACS estimates, so the roof under consideration is often partway through its own life.
Marine layer and the production curve
Coastal morning cloud is a normal feature here, and it delays production until the cloud burns off. Ask for estimated production by month and by hour where possible, and ask how the model accounts for morning cloud. A house in Chula Vista, Carlsbad, and El Cajon can produce very differently from the same array.
Tile and low-slope mounting
Ask how the array is attached for the roof type in question. Tile requires removing and reinstalling tiles around mounts, with a breakage allowance; flat and low-slope roofs need ballasted or adhered racking with attention to membrane protection. Ask how penetrations are sealed and who supplies matching tiles.
Shade from trees, parapets, and neighboring buildings
Ask how shade was measured and whether the analysis includes obstructions other than trees. In dense coastal neighborhoods, a neighboring second story or a chimney can shade a roof plane for part of the day. Ask which planes are proposed and why.
Batteries and how the house uses power
Ask what the battery can carry during an outage and for how long, where it will be installed, and whether the main panel can accommodate it. Ask how the system behaves in the late afternoon and evening, when production drops and household demand rises.
Questions to ask before signing
Where this page stops
This page does not estimate production, savings, or payback for a specific property and does not confirm which incentives or utility rules apply. Those depend on the roof, shading, equipment, and current tariff and tax rules, which should be checked with the relevant official source.
San Diego metro context
The 2024 ACS 5-year estimates put the metro at about 3.3 million residents and 1.2 million households. About 54.6% of occupied homes are owner-occupied, and about 50.0% of housing units are single-family detached, the segment where rooftop solar is most common. About 49.5% of housing units were built before 1980. This page reports Census indicators only; a NOAA station is not included for this metro in the site dataset, and a single station would not capture the difference between the coast and the inland valleys.
San Diego metro housing indicators
| Indicator | Value | Source |
|---|---|---|
| Metro population | 3,288,774 | U.S. Census Bureau |
| Households | 1,171,278 | U.S. Census Bureau |
| Owner-occupied share | 54.6% | U.S. Census Bureau |
| Single-family detached share | 50.0% | U.S. Census Bureau |
| Housing units built before 1980 | 49.5% | U.S. Census Bureau |
Census values describe the metro area, not an individual property. A climate station is not reported for this metro in the site dataset.
Frequently Asked Questions
What should I compare between solar quotes in San Diego?
Compare the gross cash price, system size, equipment models, monthly production estimates and assumptions, roof attachment details, tile breakage allowances, included electrical work, exclusions, and each warranty.
Does the marine layer reduce solar production?
Morning cloud delays production until it clears, so the daily curve is flatter than in a desert climate. Ask how the estimate accounts for local cloud patterns and compare monthly figures.
Can solar go on a tile roof?
Yes, but tiles must be removed and reinstalled around mounts, and broken tiles replaced with matching ones. Ask how that work is priced and who supplies the tiles.
Should I fix my roof before installing solar?
If the roof is near the end of its service life, it is usually cheaper to address it before mounting. Ask how roof condition is evaluated and who is responsible for removal and reinstallation later.
Who handles permits and utility interconnection?
It varies by contract. Ask which party prepares the permit and interconnection application, who schedules inspections, and who confirms permission to operate.
What is the population of the San Diego metro area?
The U.S. Census Bureau's 2024 ACS 5-year estimates report about 3.3 million residents in the metro area. The figure describes regional scale, not the number of homes or providers.
Sources and review date
- American Community Survey 2024 5-year estimates (CBSA tables) — U.S. Census Bureau, 2024 ACS 5-year estimates.
Reviewed on 2026-11-17.
Other Home Services in San Diego-Chula Vista-Carlsbad
All guides for the San Diego-Chula Vista-Carlsbad metro area