
San Francisco, CA · metro guide
Solar Panels in the Bay Area: Fog, Flat Roofs and Export Rules
Two different suns inside one metro, and a roof full of constraints before any module is placed.
Metro snapshot
San Francisco in numbers
Sources named below each block
- Population
- 4.6M
- Households
- 1.7M
- Housing units
- 1.9M
- People / household
- 2.66
- population ÷ households
Owner-occupied homes 56%
The rest are rented. Owners are the ones who commission most exterior work.
Single-family detached 49%
Detached houses carry their own roof, gutters and exterior walls.
Built before 1980 67%
Older housing stock shapes what fails first: gutters, flashing, pipe material.
Season
The year in San Francisco
- Precipitation
- 19.6 in
- Snowfall
- —
Average temperature by month, °F — the shape of the year is what decides when exterior work gets done.
Precipitation by month, inches.
| Month | Average temperature (°F) | Precipitation (in) | Snowfall (in) |
|---|---|---|---|
| January | 51.3°F | 3.89 in | — |
| February | 53.5°F | 3.96 in | — |
| March | 55.5°F | 2.73 in | — |
| April | 57.3°F | 1.36 in | — |
| May | 59.9°F | 0.48 in | — |
| June | 62.5°F | 0.14 in | — |
| July | 64.0°F | 0.00 in | — |
| August | 64.9°F | 0.04 in | — |
| September | 65.3°F | 0.07 in | — |
| October | 62.9°F | 0.79 in | — |
| November | 56.4°F | 2.04 in | — |
| December | 51.4°F | 4.14 in | — |
NOAA 1991–2020 climate normals, station SAN FRANCISCO INTL AP, CA US (USW00023234). Station observations, not a metro-wide average — a metro that spans a mountain range can differ by more than this record shows.
Population, households and housing shares: U.S. Census Bureau, American Community Survey 2024 5-year estimates, metropolitan statistical area.
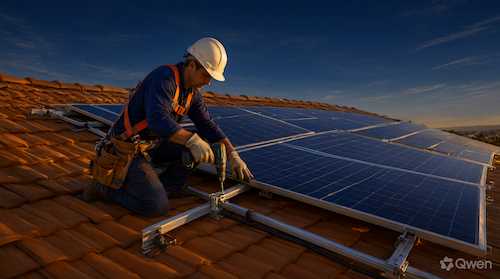
This metro contains two quite different solar climates: the fog belt along the bay and the coast, where summer afternoons can stay gray, and the inland valleys, where the sun is reliable and the cooling load is real. A production estimate built for one and applied to the other will be wrong in either direction. On top of that, the buildings are old — 66.7% of the stock predates 1980 — and many roofs are low-slope behind parapets, which changes both mounting and how much fits. The design questions here are shade and roof form first, equipment second.
Which sun you actually get
Fog is local and seasonal: a roof a few miles inland can have a materially different production profile from one near the coast, and the difference shows up most in summer mornings. A production model has to be based on the site's own irradiance and shade, not on a metro average or on a neighbor's system. Ask how the estimate was produced, what weather data it uses for that location, and whether the design was adjusted for the fog pattern rather than assuming clear skies.
Low-slope roofs and ballasted mounting
On a flat or nearly flat roof the array can be tilted to face the sun, which is an advantage over a steeply pitched roof with the wrong orientation — but the mounting has to be engineered. Ballasted systems rely on weight rather than penetration, which suits a membrane roof, and they raise questions about the structural capacity of the deck and about wind uplift at the perimeter. Ask how the mounting is specified, whether the roof structure has been assessed for the added load, and how the membrane is protected where the array sits on it.
Old panels and small services
The electrical side is often the real constraint in a pre-war building: a 100-amp service, a panel with no spare positions, or wiring that is partly original. The solar breaker has to fit within the busbar allowance, and adding storage or a car charger makes the capacity question sharper. Ask what was found at the panel, whether an upgrade is included, and whether the electrical work and the array are being planned as one project.
Export rules and storage
Compensation for exported power has been reduced across California, which shifts the economics away from a system designed to export at midday and toward one that serves the building in the evening. In a metro where a good share of the housing is multi-unit, that also raises the question of who the generation serves — a single flat, the common areas, or the whole building. Ask what arrangement applies to the address, how the design accounts for evening use, and — in a shared building — who owns the system and who benefits from it.
Permits, inspection and interconnection
The array goes up in days; the project takes considerably longer. A building permit, a permit for the electrical work, an inspection and the utility's interconnection review all bracket the installation, and in a dense city with older buildings the review can also involve a design or historic component. Ask who files each application, what the recent timeline has been for this utility, and what happens to the schedule if the review asks for a change.
What to pin down in the estimate
Where this page stops
No system sizes, prices or production figures are quoted here. Tariffs, interconnection rules and incentive programs change, so current terms should be confirmed with the utility and the state authorities rather than taken from any page.
San Francisco metro context
The 2024 ACS 5-year estimates describe about 4.65 million residents in 1,744,070 households and 1,880,374 housing units, with 55.5% owner-occupied and 48.9% single-family detached. About 66.7% of units predate 1980, which is why flat roofs and older electrical services are so often part of the scope. No climate station is reported for this metro in the site dataset, so no temperature or precipitation normals appear on this page.
San Francisco housing indicators
| Indicator | Value | Source |
|---|---|---|
| Housing units built before 1980 | 66.7% | U.S. Census Bureau |
| Single-family detached share | 48.9% | U.S. Census Bureau |
| Owner-occupied share | 55.5% | U.S. Census Bureau |
| Metro households | 1,744,070 | U.S. Census Bureau |
| Housing units | 1,880,374 | U.S. Census Bureau |
| Metro population | 4,645,029 | U.S. Census Bureau |
No climate normals are shown because no station record is held for this metro in the site dataset. Sun exposure varies sharply between the fog belt and the inland valleys, so production should be modelled per site rather than per metro.
Frequently Asked Questions
Does solar work in a foggy neighborhood?
It works, but with lower and more variable output than inland. What matters is a production model based on the site rather than a metro average, since the fog pattern differs street to street.
Can panels go on a flat roof?
Yes, and the tilt can be optimized — but the mounting has to be engineered. Ballasted systems avoid penetrations and require the deck to carry the weight, which has to be assessed.
Will my old panel block the installation?
It can, if there is no busbar allowance or no spare position. That should be established before the design is finalized, especially if storage or car charging is also planned.
Is a battery necessary?
Not always. Reduced compensation for export makes evening self-consumption more valuable, so storage is a design question tied to how the building uses power rather than a default add-on.
Who benefits from solar on a multi-unit building?
That has to be decided explicitly. The system can serve a single unit, the common areas or the whole building, and the metering and agreement have to match.
Do I need historic review?
In designated districts, visible changes can be reviewed, including panel placement and conduit routing. Confirm before the layout is fixed.
Sources and review date
- American Community Survey 2024 5-year estimates (CBSA tables) — U.S. Census Bureau, 2024 ACS 5-year estimates.
Reviewed on 2026-11-18.