
Tampa, FL · metro guide
Water Damage Restoration in Tampa: Storm Water and Heat
Tampa losses come in two kinds: the storm that arrives all at once, and the humidity that never leaves.
Metro snapshot
Tampa in numbers
Sources named below each block
- Population
- 3.3M
- Households
- 1.3M
- Housing units
- 1.5M
- People / household
- 2.48
- population ÷ households
Owner-occupied homes 68%
The rest are rented. Owners are the ones who commission most exterior work.
Single-family detached 56%
Detached houses carry their own roof, gutters and exterior walls.
Built before 1980 39%
Older housing stock shapes what fails first: gutters, flashing, pipe material.
Season
The year in Tampa
- Precipitation
- 49.5 in
- Snowfall
- 0 in
Average temperature by month, °F — the shape of the year is what decides when exterior work gets done.
Precipitation by month, inches.
| Month | Average temperature (°F) | Precipitation (in) | Snowfall (in) |
|---|---|---|---|
| January | 62.0°F | 2.65 in | 0.0 in |
| February | 64.7°F | 2.62 in | 0.0 in |
| March | 68.6°F | 2.52 in | 0.0 in |
| April | 73.9°F | 2.55 in | 0.0 in |
| May | 79.5°F | 2.60 in | 0.0 in |
| June | 82.9°F | 7.37 in | 0.0 in |
| July | 83.8°F | 7.75 in | 0.0 in |
| August | 84.0°F | 9.03 in | 0.0 in |
| September | 82.7°F | 6.09 in | 0.0 in |
| October | 77.4°F | 2.34 in | 0.0 in |
| November | 69.8°F | 1.40 in | 0.0 in |
| December | 64.9°F | 2.56 in | 0.0 in |
NOAA 1991–2020 climate normals, station TAMPA INTL AP, FL US (USW00012842). Station observations, not a metro-wide average — a metro that spans a mountain range can differ by more than this record shows.
Population, households and housing shares: U.S. Census Bureau, American Community Survey 2024 5-year estimates, metropolitan statistical area.
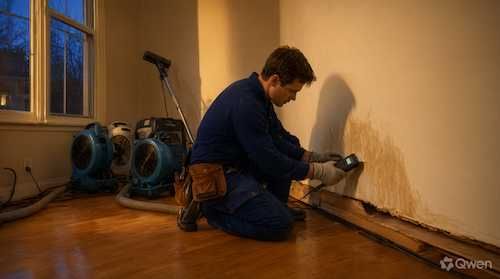
Tampa gets about 49.5 inches of rain a year, with 7.75 inches in July alone, and storm season can deliver that in a day. But the climate matters after the water arrives too: indoor temperatures stay high all year, so wet materials never get a cool pause. That combination — sudden water and fast biological growth — shapes what a good scope looks like.
Separate the sources
A scope should distinguish between wind-driven rain through an opening, a roof failure, a plumbing break, groundwater, and storm surge. They have different repair paths and often different insurance treatment. Ask how the source was confirmed and what repair is needed before reconstruction begins.
Flood water is not the same as a leak
Water that entered from the ground or a storm surge may carry contaminants, which changes what can be saved and how the work is contained. Ask whether the water category was assessed and what that means for materials, cleaning, and disposal. A scope written for a clean supply-line leak does not fit a flooded room.
Drying in a hot, humid climate
High outdoor humidity slows evaporation, so fans alone are often not enough. Ask whether dehumidification is included, how the space is closed off, and how progress is measured. Ask for moisture readings with locations and dates and the dry standard used to close the job.
Wall cavities and insulation
Wet insulation inside a wall rarely returns to service, and in a hot climate the cavity can stay warm and damp. Ask which materials will be removed rather than dried and how the cavity is verified afterwards. A wall that reads dry on the surface can still hold moisture behind the board.
Questions worth asking before work begins
Where this page stops
This guide does not assess an active loss remotely and does not publish local prices. If water is still entering or there is an electrical safety concern, contact the appropriate emergency service. Coverage and remediation requirements depend on the property, the policy, and the responsible local authority.
Tampa metro context
The 2024 ACS 5-year estimates put the metro at about 3.3 million residents and 1.3 million households. About 67.9% of occupied homes are owner-occupied, and about 56.2% of housing units are single-family detached. About 39.0% of housing units were built before 1980. NOAA's Tampa station records January averaging 62.0°F, July 83.8°F, with 7.75 inches of rain in July and about 49.5 inches a year.
Tampa reference station and housing indicators
| Indicator | Value | Source |
|---|---|---|
| January mean temperature | 62.0°F | NOAA NCEI |
| July mean temperature | 83.8°F | NOAA NCEI |
| July precipitation | 7.75 in. | NOAA NCEI |
| Annual precipitation | 49.5 in. | NOAA NCEI |
| Metro population | 3,304,691 | U.S. Census Bureau |
| Housing units built before 1980 | 39.0% | U.S. Census Bureau |
Station normals are historical averages for one location, not a forecast. Census values describe the metro area, not an individual property.
Frequently Asked Questions
What should I do first after discovering water damage?
Stop the source if it is safe to do so, keep people away from electrical hazards, and document the affected area with dated photos. Then arrange an assessment and get extraction and drying started.
Is flood damage covered by homeowners insurance?
Flood damage is typically handled separately from a standard homeowners policy. Ask your insurer about the specific policy and coverage before assuming either way.
How fast can mold grow in a Tampa home?
Warm indoor temperatures favor growth on wet materials, so the timeline is short. Ask how quickly work can begin and which materials will be removed rather than dried.
How is drying verified?
Drying is normally checked with moisture readings taken at documented locations and compared over time, along with visual inspection. Ask for the readings and the dry standard used to close the job.
What is the difference between mitigation and reconstruction?
Mitigation covers extraction, removal of unsalvageable material, drying, and cleaning. Reconstruction restores the structure and finishes. Ask which parts are included and which are separate.
What is the population of the Tampa metro area?
The U.S. Census Bureau's 2024 ACS 5-year estimates report about 3.3 million residents in the metro area. The figure describes regional scale, not the number of homes or providers.
Sources and review date
- American Community Survey 2024 5-year estimates (CBSA tables) — U.S. Census Bureau, 2024 ACS 5-year estimates.
- 1991–2020 station normals — TAMPA INTL AP, FL US (USW00012842) — NOAA National Centers for Environmental Information, 1991–2020 climate normals.
Reviewed on 2026-11-17.
Other Home Services in Tampa–St. Petersburg–Clearwater
All guides for the Tampa–St. Petersburg–Clearwater metro area