
Austin, TX · metro guide
Gutter Cleaning in Austin: Flash-Flood Alley, Live Oak Debris and Limestone
Rain that arrives faster than almost anywhere else in the country, under trees that shed all year.
Metro snapshot
Austin in numbers
Sources named below each block
- Population
- 2.4M
- Households
- 989K
- Housing units
- 1.0M
- People / household
- 2.45
- population ÷ households
Owner-occupied homes 58%
The rest are rented. Owners are the ones who commission most exterior work.
Single-family detached 59%
Detached houses carry their own roof, gutters and exterior walls.
Built before 1980 19%
Older housing stock shapes what fails first: gutters, flashing, pipe material.
Season
The year in Austin
- Precipitation
- 36.2 in
- Snowfall
- 0.2 in
Average temperature by month, °F — the shape of the year is what decides when exterior work gets done.
Precipitation by month, inches.
Snowfall by month, inches.
| Month | Average temperature (°F) | Precipitation (in) | Snowfall (in) |
|---|---|---|---|
| January | 52.2°F | 2.64 in | 0.0 in |
| February | 56.1°F | 1.89 in | 0.2 in |
| March | 62.8°F | 2.88 in | 0.0 in |
| April | 69.6°F | 2.42 in | 0.0 in |
| May | 76.8°F | 5.04 in | 0.0 in |
| June | 83.0°F | 3.68 in | 0.0 in |
| July | 85.8°F | 1.96 in | 0.0 in |
| August | 86.5°F | 2.74 in | 0.0 in |
| September | 80.8°F | 3.45 in | 0.0 in |
| October | 71.6°F | 3.91 in | 0.0 in |
| November | 61.0°F | 2.92 in | 0.0 in |
| December | 53.6°F | 2.72 in | 0.0 in |
NOAA 1991–2020 climate normals, station AUSTIN-CAMP MABRY, TX US (USW00013958). Station observations, not a metro-wide average — a metro that spans a mountain range can differ by more than this record shows.
Population, households and housing shares: U.S. Census Bureau, American Community Survey 2024 5-year estimates, metropolitan statistical area.
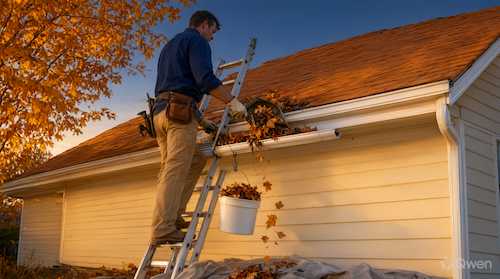
Austin sits in what is often called Flash Flood Alley, where storms can drop a great deal of rain in a short time on ground that sheds it. The city's live oaks are evergreen, so they drop leaves and small twigs continuously rather than seasonally, and juniper adds pollen in winter. Only 19.2% of the housing predates 1980, so most gutters are recent — which means capacity and discharge, not corrosion, are the things that fail.
Flash-flood rainfall and capacity
Storms here can deliver more rain in an hour than a residential run can carry, so the outcome depends on whether the run is clear enough to pass what it can and send the rest over the front edge rather than down the fascia. Ask whether the outlets are confirmed to flow.
Live oaks that drop all year
Live oaks are evergreen, so there is no leaf-drop season to schedule around: leaves, catkins and small twigs arrive continuously and collect in the channel and the outlet. That is why a single annual clean is rarely enough here. Ask how many visits the trees over the roof actually justify.
Limestone, caliche and dust
The ground is limestone and caliche, and both produce a pale dust that settles on roofs and washes into runs as a fine silt at the low points. That silt is easy to miss and hard to flush. Ask whether outlets are cleared of silt.
New-build runs and their discharge
With most of the stock built after 1980, the common problem is a run continuous around several roof planes with only a few downspouts, plus a discharge point that was never given a path. Ask how many downspouts serve each run and where the water leaves the lot.
Heat and ageing components
Summer heat and ultraviolet degrade sealants and plastic outlets, and joints open over a few seasons. Ask whether joints and seals are inspected along with the debris.
What to pin down in the estimate
Where this page stops
No prices are quoted and no property is assessed here. Flood risk, grading and structural movement are matters for an engineer or the local authority, and nothing here is drainage design.
Austin metro context
The 2024 ACS 5-year estimates describe about 2.43 million residents in 989,434 households and 1,042,843 housing units, with 58.3% owner-occupied and 59.0% single-family detached. About 19.2% of units predate 1980. At the Austin-Camp Mabry reference station January averages 52.2°F and July 85.8°F, on 36.2 inches of annual precipitation.
Austin reference station and housing indicators
| Indicator | Value | Source |
|---|---|---|
| January mean temperature | 52.2°F | NOAA NCEI |
| July mean temperature | 85.8°F | NOAA NCEI |
| Annual precipitation | 36.2 in. | NOAA NCEI |
| Metro population | 2,426,592 | U.S. Census Bureau |
| Owner-occupied share | 58.3% | U.S. Census Bureau |
| Housing units built before 1980 | 19.2% | U.S. Census Bureau |
Station normals are historical averages for one location, not a forecast. What a gutter has to carry depends on roof area, pitch, the debris the surrounding trees drop and whether downspouts discharge where the water can leave.
Frequently Asked Questions
Why do my gutters need clearing more than once a year?
Live oaks are evergreen and drop continuously. There is no season to work around, so the run reloads all year.
Can gutters prevent flash flooding?
No. They make sure the roof drains as well as it can, but a storm of that intensity exceeds any residential system.
What is the pale silt in my gutters?
Limestone and caliche dust washed off the roof. It settles at low points and blocks the outlets.
My house is new — why does it overflow?
Capacity. Fewer downspouts than the roof area needs is common on recent builds, so any restriction sends water over the edge.
Where should the downspout end?
Somewhere the water has a defined path off the lot rather than pooling against the foundation.
Does heat affect gutters?
It degrades sealant and plastic parts, so joints open over a few seasons even with no impact damage.
Sources and review date
- American Community Survey 2024 5-year estimates (CBSA tables) — U.S. Census Bureau, 2024 ACS 5-year estimates.
- 1991–2020 station normals — AUSTIN-CAMP MABRY, TX US (USW00013958) — NOAA National Centers for Environmental Information, 1991–2020 climate normals.
Reviewed on 2026-11-18.