
Pittsburgh, PA · metro guide
HVAC in Pittsburgh: Radiators, Hillside Houses, and No Ductwork
The oldest housing stock on this site means the heating system is often original and the cooling system does not exist yet.
Metro snapshot
Pittsburgh in numbers
Sources named below each block
- Population
- 2.4M
- Households
- 1.1M
- Housing units
- 1.2M
- People / household
- 2.30
- population ÷ households
Owner-occupied homes 71%
The rest are rented. Owners are the ones who commission most exterior work.
Single-family detached 68%
Detached houses carry their own roof, gutters and exterior walls.
Built before 1980 73%
Older housing stock shapes what fails first: gutters, flashing, pipe material.
Season
The year in Pittsburgh
- Precipitation
- 39.6 in
- Snowfall
- 44.1 in
Average temperature by month, °F — the shape of the year is what decides when exterior work gets done.
Precipitation by month, inches.
Snowfall by month, inches.
| Month | Average temperature (°F) | Precipitation (in) | Snowfall (in) |
|---|---|---|---|
| January | 28.8°F | 2.96 in | 13.3 in |
| February | 31.4°F | 2.62 in | 11.7 in |
| March | 39.7°F | 3.15 in | 7.6 in |
| April | 51.5°F | 3.32 in | 1.0 in |
| May | 61.2°F | 3.83 in | 0.0 in |
| June | 69.4°F | 4.12 in | 0.0 in |
| July | 73.2°F | 4.26 in | 0.0 in |
| August | 71.8°F | 3.52 in | 0.0 in |
| September | 64.9°F | 3.30 in | 0.0 in |
| October | 53.4°F | 2.83 in | 0.4 in |
| November | 42.6°F | 2.86 in | 2.4 in |
| December | 33.7°F | 2.84 in | 7.7 in |
NOAA 1991–2020 climate normals, station PITTSBURGH INTL AP, PA US (USW00094823). Station observations, not a metro-wide average — a metro that spans a mountain range can differ by more than this record shows.
Population, households and housing shares: U.S. Census Bureau, American Community Survey 2024 5-year estimates, metropolitan statistical area.
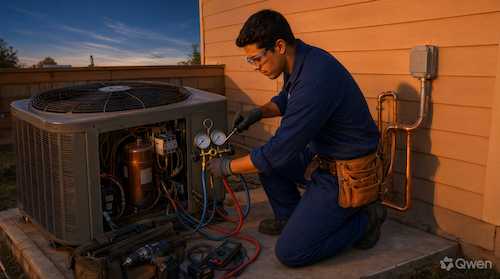
With 73.1% of metro housing built before 1980, and much of the city's stock predating the Second World War, Pittsburgh's heating systems were installed before ductwork was standard practice. Hot water radiators, steam radiators and a boiler in the basement are still the norm in many neighborhoods, and they work well. The complication is everything else: cooling, ventilation and filtration all want ducts, and a brick rowhouse on a hillside has no chases to put them in. That is why the local conversation usually splits into keeping the hydronic system and solving cooling a different way.
Keeping the boiler is usually right
A working hydronic system is quiet, comfortable and inexpensive to keep running relative to replacement. The essential distinction is steam versus hot water: they are maintained differently, and a contractor who treats one as the other will misdiagnose the problem. Ask which system the house has, what the boiler's condition and combustion test show, whether the radiators will be balanced, and what the basement provides in venting and combustion air. If replacement is proposed, ask why and what happens to the distribution system.
Cooling a house with no ducts
The three realiztic routes are conventional ducts through chases and dropped soffits, high-velocity small-duct systems, and ductless mini-splits serving individual rooms. Each has trade-offs. Small-duct systems need careful design and do not expand casually; mini-splits heat and cool room by room unless the layout is planned; conventional ducts in a plaster-and-brick house mean visible compromise somewhere. Ask how many heads or outlets are proposed, which rooms they serve, what happens to the rooms left out, and where the outdoor unit can sit without upsetting a neighbor or a historic facade.
Hillside houses and multiple levels
Houses built into a slope often have three or four levels with different heat loss characteristics and no natural circulation between them. That makes zoning more important than raw capacity: a single thermostat in a hallway cannot serve a house arranged like that. Ask how the proposal addresses the levels individually, whether separate zones or heads are proposed, and how the system behaves on the coldest nights when the upper floors are warmest from rising heat.
A real heating season and what it costs
January averages 28.8°F at the airport station and 44.1 inches of snow falls in a typical year, so heating runs for months. That makes combustion efficiency worth attention: a boiler or furnace that has never been tuned is running below its potential, and combustion testing is a safety check as well as an efficiency one. Ask what the seasonal service includes — combustion analysis, heat exchanger inspection, expansion tank and relief valve — and whether the chimney or flue has been inspected, since masonry chimneys in old houses are often in poor condition.
Service before the first cold week
Equipment fails when it works hardest, and the first sustained cold snap is also when every contractor's schedule is full. Autumn service on the heating side, spring on the cooling side, and a clean filter schedule cover most of the risk. Ask what the visit includes and whether priority scheduling is part of the agreement, and keep the report, because a documented service history is useful when the equipment eventually fails.
What a proposal should answer
Where this page stops
No prices and no equipment recommendations are published here. Sizing, combustion safety and refrigerant work require on-site assessment by a licensed professional, and permit and historic-district questions belong to the local authority.
Pittsburgh metro context
ACS 2024 5-year estimates describe about 2.44 million residents in 1,061,705 households and 1,174,149 housing units, with 70.7% owner-occupied and 68.0% single-family detached. About 73.1% of units were built before 1980 — the oldest stock on this site — which is why boilers, radiators and ductless retrofits dominate. NOAA's station records January at 28.8°F, July at 73.2°F and 44.1 inches of annual snowfall.
Pittsburgh heating season and housing age
| Indicator | Value | Source |
|---|---|---|
| January mean temperature | 28.8°F | NOAA NCEI |
| July mean temperature | 73.2°F | NOAA NCEI |
| Annual snowfall | 44.1 in. | NOAA NCEI |
| Annual precipitation | 39.6 in. | NOAA NCEI |
| Housing units built before 1980 | 73.1% | U.S. Census Bureau |
| Single-family detached share | 68.0% | U.S. Census Bureau |
Monthly means are 30-year station averages. A design load uses a colder outdoor condition than the January mean and must be calculated for the specific building.
Frequently Asked Questions
Should I keep my radiators?
Usually yes, if the system is in good condition. Hydronic heat is comfortable and quiet, and ductwork in a brick house means losing space to chases. The usual reason to change is air conditioning, which can often be added with a ductless system while keeping the radiators.
How do I know whether I have steam or hot water heat?
Steam systems have a boiler that boils water, radiators with a vent near the top, and pipes that may knock or whistle. Hot water systems run a circulator pump and have no such vent. The distinction changes maintenance and repair.
Can I cool a brick rowhouse?
Yes, but not with a ducted system in most cases. Mini-splits are the usual answer, with heads placed to serve the rooms that matter most. Conventional ducts are possible but involve visible compromise somewhere in the building.
Why does my upper floor overheat?
Rising heat plus a single thermostat in a hallway. Zoning, a separate head for the upper rooms, or a second system addresses it directly, while adding capacity to the existing system usually overcools the lower floors.
How often should heating equipment be serviced?
Annually before the heating season for combustion equipment, and a cooling check in spring. In a climate with a long heating season, skipping the autumn visit is the expensive choice.
Is the chimney part of the HVAC conversation?
Yes, since a masonry chimney in an old house can be in poor condition and affects how the appliance vents. Ask whether it has been inspected, and treat that as part of the service rather than a separate afterthought.
Sources and review date
- American Community Survey 2024 5-year estimates (CBSA tables) — U.S. Census Bureau, 2024 ACS 5-year estimates.
- 1991–2020 station normals — PITTSBURGH INTL AP, PA US (USW00094823) — NOAA National Centers for Environmental Information, 1991–2020 climate normals.
Reviewed on 2026-11-18.