
Portland, OR-WA · metro guide
Solar Panels in Portland: Summer Sun, Winter Fog and Two States
A metro that spans two states with different rules, and a year that is generous in July and thin in December.
Metro snapshot
Portland in numbers
Sources named below each block
- Population
- 2.5M
- Households
- 1.0M
- Housing units
- 1.1M
- People / household
- 2.50
- population ÷ households
Owner-occupied homes 62%
The rest are rented. Owners are the ones who commission most exterior work.
Single-family detached 60%
Detached houses carry their own roof, gutters and exterior walls.
Built before 1980 46%
Older housing stock shapes what fails first: gutters, flashing, pipe material.
Season
The year in Portland
- Precipitation
- 36.9 in
- Snowfall
- 4.2 in
Average temperature by month, °F — the shape of the year is what decides when exterior work gets done.
Precipitation by month, inches.
Snowfall by month, inches.
| Month | Average temperature (°F) | Precipitation (in) | Snowfall (in) |
|---|---|---|---|
| January | 41.9°F | 5.03 in | 1.7 in |
| February | 44.1°F | 3.68 in | 1.2 in |
| March | 48.3°F | 3.97 in | 0.1 in |
| April | 52.8°F | 2.89 in | 0.0 in |
| May | 59.4°F | 2.51 in | 0.0 in |
| June | 64.2°F | 1.63 in | 0.0 in |
| July | 70.2°F | 0.51 in | 0.0 in |
| August | 70.6°F | 0.54 in | 0.0 in |
| September | 65.4°F | 1.52 in | 0.0 in |
| October | 55.6°F | 3.42 in | 0.0 in |
| November | 47.1°F | 5.45 in | 0.0 in |
| December | 41.6°F | 5.77 in | 1.2 in |
NOAA 1991–2020 climate normals, station PORTLAND INTL AP, OR US (USW00024229). Station observations, not a metro-wide average — a metro that spans a mountain range can differ by more than this record shows.
Population, households and housing shares: U.S. Census Bureau, American Community Survey 2024 5-year estimates, metropolitan statistical area.
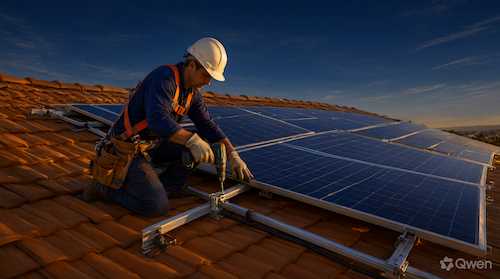
Solar works here, but the shape of the year matters more than the annual total. July averages 70.2°F with 0.51 inches of rain, while January brings 5.03 inches and a mean of 41.9°F — so a system produces most of its output in a few bright months and relatively little through the wet season. That has two practical consequences: the design has to be honest about the winter, and the array needs to survive months of damp. Add the fact that this metro crosses a state line, with different incentive and net-metering rules on each side, and the administrative side becomes as important as the roof.
The seasonal shape of production
A production estimate quoted as an annual figure hides the thing households notice: December and January are quiet, and the wet season coincides with the months of highest consumption. That does not make solar a poor investment, but it changes how the system should be sized and whether storage or a time-of-use strategy matters. Ask for a monthly production curve rather than an annual number, and check that the estimate assumes the shading and orientation of this roof rather than an ideal one.
Moss, debris and the mounting
An array on a roof in this climate collects what any roof collects: needles, leaves and moss at the panel edges and in the gap behind them. Debris that stays wet against a module frame and a roof surface is a maintenance item, and on a roof that already grows moss it accelerates. Mounting with an air gap rather than flush helps both debris and heat. Ask how the mounting is specified, what access there is for clearing debris, and whether the array will make an existing moss problem harder to treat.
Roof age is a harder question here
With 45.5% of the stock predating 1980 and moss shortening the life of a shingle covering, the roof under an array is more likely to need replacement during the system's life than in a dry climate. Removing and reinstalling panels later is an extra cost that no first quote includes, and it puts the penetrations through a second cycle. Ask the age and condition of the covering, whether it grows moss, and what the arrangement is if it has to be replaced.
One metro, two sets of rules
The metro spans Oregon and Washington, and the two states have different approaches to net metering, incentives and interconnection. That means two addresses a few miles apart can have materially different economics for the same roof. Ask which state and which utility serve the address, what the current export arrangement is, and who files the interconnection — because the rules, not the sunshine, will drive the difference.
Trees, shade and the low winter sun
This is a well-planted metro, and a mature tree to the south can decide the whole design. Shade is worst in winter, when the sun is low and even bare canopy blocks much of the sky, and that is also when production is thinnest. Module-level electronics can limit the loss from a shaded corner but cannot create output that is not there. Ask how shading was measured, what the design does about the shaded hours, and what the estimate assumes about the trees as they grow.
What to pin down in the estimate
Where this page stops
No system sizes, prices or production figures are quoted here. State programs, tariffs and interconnection rules change, so current terms should be confirmed with the utility and the state authorities rather than taken from any page.
Portland metro context
The 2024 ACS 5-year estimates describe about 2.52 million residents in 1,010,265 households and 1,062,495 housing units, with 61.7% owner-occupied and 60.2% single-family detached. About 45.5% of units predate 1980, so roof age is a live question on most of the stock. At the reference station July averages 70.2°F on 0.51 inches of rain, against 5.03 inches in January.
Portland reference station and housing indicators
| Indicator | Value | Source |
|---|---|---|
| January mean temperature | 41.9°F | NOAA NCEI |
| July mean temperature | 70.2°F | NOAA NCEI |
| Annual precipitation | 36.9 in. | NOAA NCEI |
| Metro population | 2,520,987 | U.S. Census Bureau |
| Owner-occupied share | 61.7% | U.S. Census Bureau |
| Housing units built before 1980 | 45.5% | U.S. Census Bureau |
Station normals are historical averages for one location, not a forecast. The concentration of rainfall outside summer is what makes winter output low here, and it is why a monthly curve is more useful than an annual total.
Frequently Asked Questions
Does solar make sense in a cloudy climate?
Yes, with realiztic expectations. Summer output is strong and winter output is thin, so the economics depend on how the year as a whole is used rather than on a single bright month.
What happens to panels in the wet season?
They keep working; output is just lower. The maintenance question is debris and moss collecting at the frame and behind the array, which is easier to manage with an air gap and planned access.
Should I replace the roof first?
More often here than in a dry climate, because moss shortens the covering's life. Removing and reinstalling an array later costs more than doing the roof first.
Why do two nearby addresses get different proposals?
Because the metro crosses a state line, and each state sets its own export and incentive rules. The utility and the state matter as much as the roof.
Is storage worth adding?
It depends on the export arrangement and on when the household uses power. In a wet winter, storage shifts summer generation rather than solving winter shortfall.
How long does the process take?
The installation is short; the permit and interconnection review are not. Ask about recent timelines for the specific utility rather than a general figure.
Sources and review date
- American Community Survey 2024 5-year estimates (CBSA tables) — U.S. Census Bureau, 2024 ACS 5-year estimates.
- 1991–2020 station normals — PORTLAND INTL AP, OR US (USW00024229) — NOAA National Centers for Environmental Information, 1991–2020 climate normals.
Reviewed on 2026-11-18.