
Riverside, CA · metro guide
Gutter Cleaning in Riverside: Santa Ana Winds, Wash Flooding and Grit
Nine inches of rain that all arrives at once, after wind has filled the gutters with grit.
Metro snapshot
Riverside in numbers
Sources named below each block
- Population
- 4.7M
- Households
- 1.5M
- Housing units
- 1.6M
- People / household
- 3.22
- population ÷ households
Owner-occupied homes 66%
The rest are rented. Owners are the ones who commission most exterior work.
Single-family detached 69%
Detached houses carry their own roof, gutters and exterior walls.
Built before 1980 36%
Older housing stock shapes what fails first: gutters, flashing, pipe material.
Season
The year in Riverside
- Precipitation
- 9.4 in
- Snowfall
- —
Average temperature by month, °F — the shape of the year is what decides when exterior work gets done.
Precipitation by month, inches.
| Month | Average temperature (°F) | Precipitation (in) | Snowfall (in) |
|---|---|---|---|
| January | 55.6°F | 2.29 in | — |
| February | 56.3°F | 2.41 in | — |
| March | 59.5°F | 1.21 in | — |
| April | 62.9°F | 0.59 in | — |
| May | 67.6°F | 0.20 in | — |
| June | 73.0°F | 0.01 in | — |
| July | 78.6°F | 0.12 in | — |
| August | 79.8°F | 0.02 in | — |
| September | 76.6°F | 0.11 in | — |
| October | 68.9°F | 0.33 in | — |
| November | 61.0°F | 0.57 in | — |
| December | 54.8°F | 1.51 in | — |
NOAA 1991–2020 climate normals, station RIVERSIDE MUNI AP, CA US (USW00003171). Station observations, not a metro-wide average — a metro that spans a mountain range can differ by more than this record shows.
Population, households and housing shares: U.S. Census Bureau, American Community Survey 2024 5-year estimates, metropolitan statistical area.
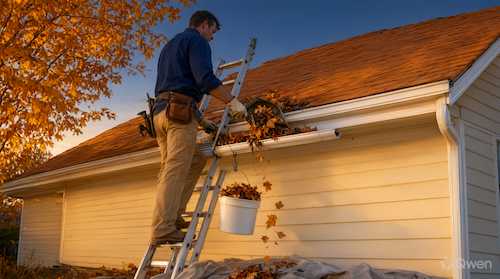
The Inland Empire gets 9.4 inches of rain a year, and like the rest of Southern California it gets it in a handful of storms. The Santa Ana winds are the other half: they arrive hot and dry from the interior, strip material off trees and roofs and fill gutters with grit. When the rain finally comes, the run is full of what the wind left, and the washes and storm channels that carry the water away are already the constraint.
Santa Ana debris and grit
Santa Ana events strip leaves, twigs and roof grit into the runs and dry everything out afterwards so the material sets. A gutter can go from clear to restricted in a single wind event. Ask whether the visit is scheduled after the windy season rather than before it.
Storms that deliver the year at once
The year's rain arrives in a few events, so the run gets one chance to work and then months of nothing. Ask whether the visit happens before the storm season and whether the outlets are confirmed to flow.
Tile and gravel roofs
Much of the local housing has tile or gravel-surfaced roofs, and both shed grit into the channel continuously. That grit is heavier than leaves and blocks outlets at the bottom. Ask whether outlets are cleared of grit.
Washes, channels and where water goes
The region drains through washes and channels designed for fast flow, and roof discharge onto ground that slopes toward one of them can deliver water where it is not wanted. Ask where the discharge ends up.
Older runs and dry rot
With 36.2% of the stock predating 1980, original runs and fascia boards are common, and fascia that has been damp from repeated overflow decays quietly in the dry climate. Ask whether fascia condition is reported.
What to pin down in the estimate
Where this page stops
No prices are quoted and no property is assessed here. Flood risk, wash capacity and slope stability belong to the local authority or an engineer.
Riverside metro context
The 2024 ACS 5-year estimates describe about 4.68 million residents in 1,450,250 households and 1,613,300 housing units, with 65.8% owner-occupied and 69.2% single-family detached. About 36.2% of units predate 1980. At the Riverside Muni Ap reference station January averages 55.6°F and July 78.6°F, on 9.4 inches of annual precipitation.
Riverside reference station and housing indicators
| Indicator | Value | Source |
|---|---|---|
| January mean temperature | 55.6°F | NOAA NCEI |
| July mean temperature | 78.6°F | NOAA NCEI |
| Annual precipitation | 9.4 in. | NOAA NCEI |
| Metro population | 4,675,704 | U.S. Census Bureau |
| Owner-occupied share | 65.8% | U.S. Census Bureau |
| Housing units built before 1980 | 36.2% | U.S. Census Bureau |
Station normals are historical averages for one location, not a forecast. What a gutter has to carry depends on roof area, pitch, the debris the surrounding trees drop and whether downspouts discharge where the water can leave.
Frequently Asked Questions
Why do my gutters fill with grit rather than leaves?
Tile and gravel roofs shed grit continuously, and Santa Ana winds add whatever is loose. Grit is heavier and settles at the outlets.
When should gutters be cleaned here?
After the windy season and before the winter storms, so the run is clear when the rain finally comes.
Will gutters help with flash flooding?
No. They make the roof drain as well as it can; the storm exceeds the system and the washes do the rest.
Can a dry climate rot fascia?
Yes, if the run overflows repeatedly. The wood stays damp after each event and decays slowly between them.
How often should gutters be cleaned in the Inland Empire?
Usually once a year is enough for debris, timed after the winds, with the outlet check being the important part.
What if my downspout discharges toward a wash?
That needs a defined path rather than an improvised one, because the wash is already carrying more water than the street.
Sources and review date
- American Community Survey 2024 5-year estimates (CBSA tables) — U.S. Census Bureau, 2024 ACS 5-year estimates.
- 1991–2020 station normals — RIVERSIDE MUNI AP, CA US (USW00003171) — NOAA National Centers for Environmental Information, 1991–2020 climate normals.
Reviewed on 2026-11-18.
Other Home Services in Riverside–San Bernardino–Ontario
All guides for the Riverside–San Bernardino–Ontario metro area